Gold Analysis (1H Chart)
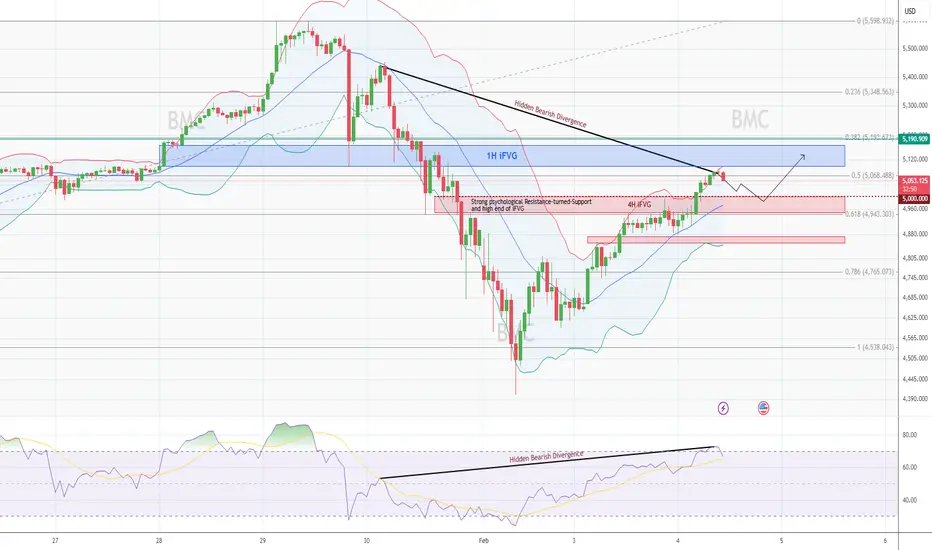
Gold rose more than 2.5% during the early Asian session on Wednesday, and made highs of 5081.25
Although to test the mentioned highs, it has exhausted much of its strength
The bullish price action is getting weak, forming smaller candles than previous, with falling volumes every next candle
And the prices have entered the overbought zone on the 1H chart:
- Prices are testing the upper Bollinger band
- RSI is also trending above 70 levels and turning
- A hidden bearish divergence could also be identified on the 1H chart
Projection
- Thus, a moderate downside correction cannot be neglected towards the marked red zone (5000-4950): The resistance turned support or iFVG
- After which prices might continue the bullish trend towards the blue zone (1H iFVG between 5100-5170).
Aviso legal
As informações e publicações não se destinam a ser, e não constituem, conselhos ou recomendações financeiras, de investimento, comerciais ou de outro tipo fornecidos ou endossados pela TradingView. Leia mais nos Termos de Uso.
Aviso legal
As informações e publicações não se destinam a ser, e não constituem, conselhos ou recomendações financeiras, de investimento, comerciais ou de outro tipo fornecidos ou endossados pela TradingView. Leia mais nos Termos de Uso.