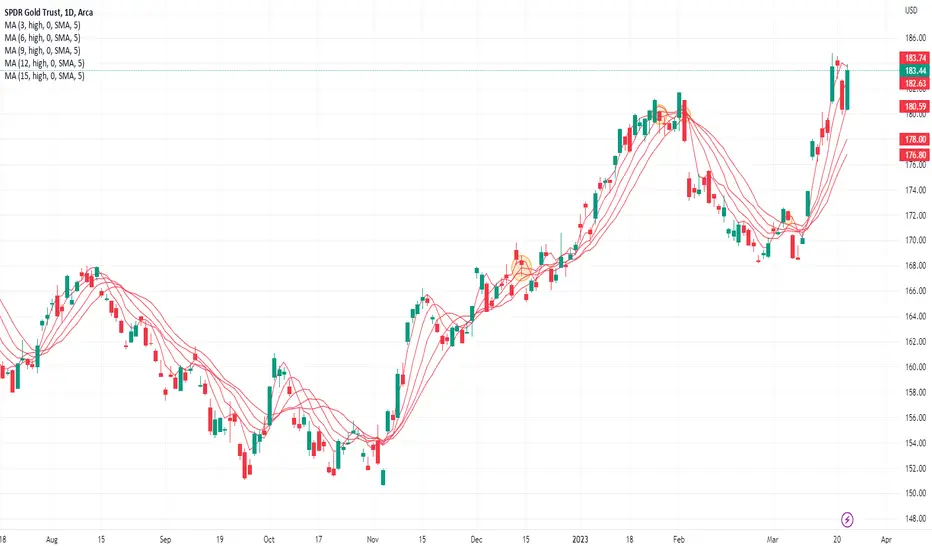
So I am going to try to share the template for this analysis so community can see what I am seeing. But here anyway is the indicator set if creating manually. Use the moving average of highs for the 3,6,9,12,15 day moving average of highs on the GLD chart. Look at the last 6 months or so. The MA is flat on these dates and would per the method indicate a short trade with price penetrating from above at each of those dates being: Dec 14, Jan 26, Feb 2, Mar 6. Maybe I will try to post chart separately. I will do the same with long side trades and some other markets. Any and all feedback is welcome.
Aviso legal
As informações e publicações não devem ser e não constituem conselhos ou recomendações financeiras, de investimento, de negociação ou de qualquer outro tipo, fornecidas ou endossadas pela TradingView. Leia mais em Termos de uso.
Aviso legal
As informações e publicações não devem ser e não constituem conselhos ou recomendações financeiras, de investimento, de negociação ou de qualquer outro tipo, fornecidas ou endossadas pela TradingView. Leia mais em Termos de uso.