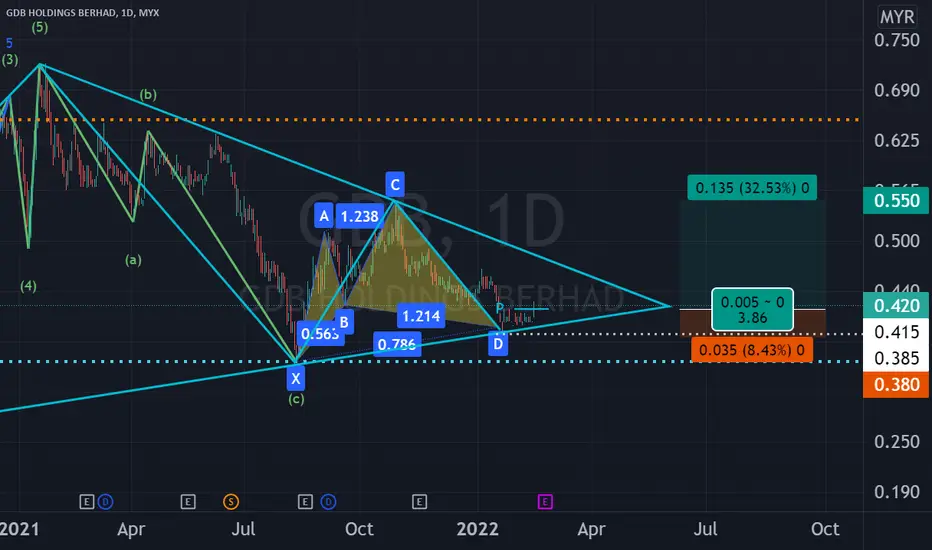
Consider to study, analyze and monitor GDB in its daily chart where the following patterns appear to have been formed: 1. Triangle; 2. Bullish Cypher and 3. EW ABC Corrective Zone at C zone.
Trade within the triangle or trade as per the potential Cypher Pattern Trading Plan as depicted in the chart.
This is not a trade or investment call but for study and sharing purposes only with a view to develop and enhance one's trading knowledge and skill. Trade at your own risk.
Trade within the triangle or trade as per the potential Cypher Pattern Trading Plan as depicted in the chart.
This is not a trade or investment call but for study and sharing purposes only with a view to develop and enhance one's trading knowledge and skill. Trade at your own risk.
Aviso legal
As informações e publicações não se destinam a ser, e não constituem, conselhos ou recomendações financeiras, de investimento, comerciais ou de outro tipo fornecidos ou endossados pela TradingView. Leia mais nos Termos de Uso.
Aviso legal
As informações e publicações não se destinam a ser, e não constituem, conselhos ou recomendações financeiras, de investimento, comerciais ou de outro tipo fornecidos ou endossados pela TradingView. Leia mais nos Termos de Uso.