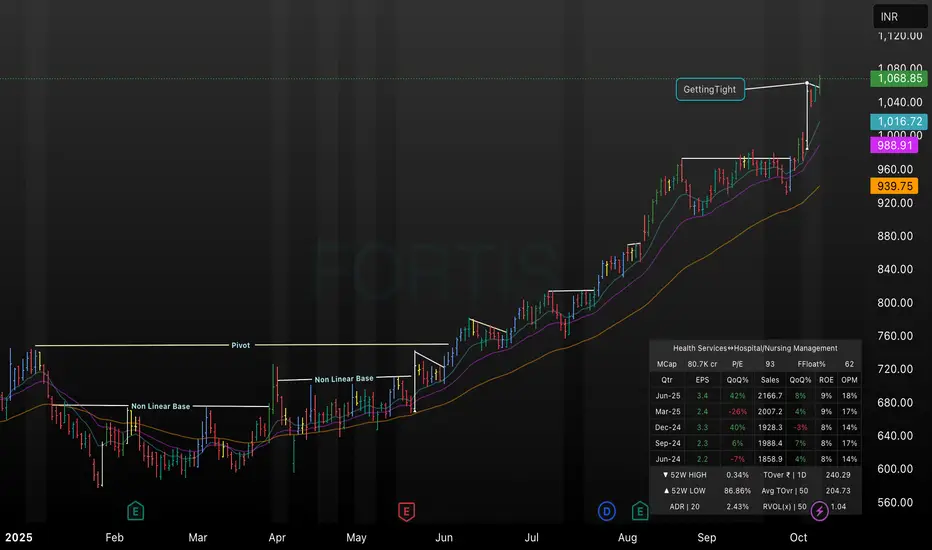
This TradingView daily chart for Fortis (2025) illustrates key technical setups including two clearly labeled non-linear base formations, a major pivot breakout, and subsequent price consolidation zones. The chart captures the transition from range-bound action to a strong bullish move, highlighting the “Getting Tight” pattern before this recent surge. Additional metrics such as moving averages, volume overlays, and stock fundamentals are visible, providing a comprehensive overview for swing or positional traders seeking technical clarity.
Aviso legal
As informações e publicações não devem ser e não constituem conselhos ou recomendações financeiras, de investimento, de negociação ou de qualquer outro tipo, fornecidas ou endossadas pela TradingView. Leia mais em Termos de uso.
Aviso legal
As informações e publicações não devem ser e não constituem conselhos ou recomendações financeiras, de investimento, de negociação ou de qualquer outro tipo, fornecidas ou endossadas pela TradingView. Leia mais em Termos de uso.