Analysis:
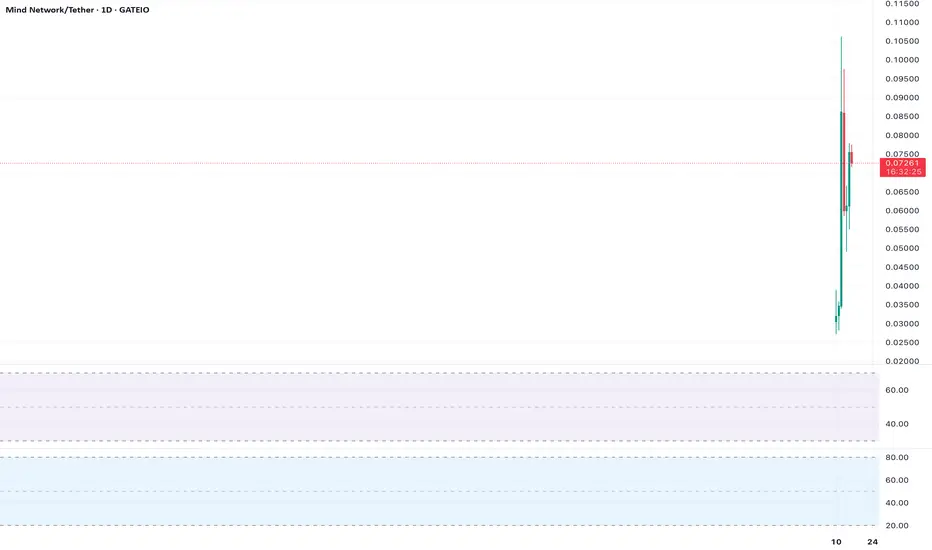
 FHE’s daily chart shows a potential double bottom at $0.00000075, a bullish pattern. The price is at $0.00000079, with RSI rising from oversold levels (30). A move above $0.00000085 confirms the pattern, targeting $0.0000011. Low volume is a risk.
Actionable Insight:
Long on a break above $0.00000085, targeting $0.0000011. Stop-loss at $0.00000074. Confirm with volume before entry.
Chart Setup:
Timeframe: Daily
Indicators: RSI, Double Bottom
Levels: Neckline ($0.00000085), Target ($0.0000011)
Actionable Insight:
Long on a break above $0.00000085, targeting $0.0000011. Stop-loss at $0.00000074. Confirm with volume before entry.
Chart Setup:
Timeframe: Daily
Indicators: RSI, Double Bottom
Levels: Neckline ($0.00000085), Target ($0.0000011)
Aviso legal
As informações e publicações não devem ser e não constituem conselhos ou recomendações financeiras, de investimento, de negociação ou de qualquer outro tipo, fornecidas ou endossadas pela TradingView. Leia mais em Termos de uso.
Aviso legal
As informações e publicações não devem ser e não constituem conselhos ou recomendações financeiras, de investimento, de negociação ou de qualquer outro tipo, fornecidas ou endossadas pela TradingView. Leia mais em Termos de uso.