Fetch.ai (FET) Chart Analysis: Observing a Bullish Pennant Break
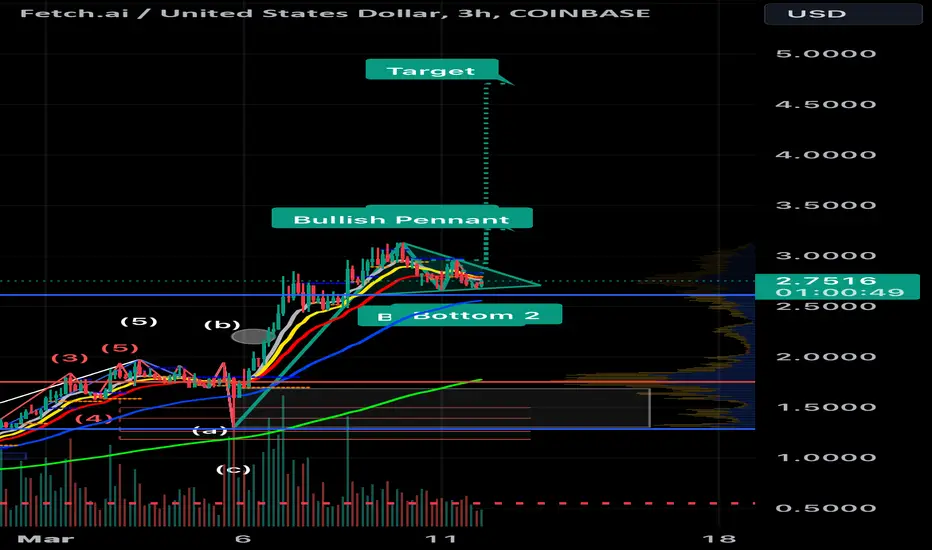
The FET/USD 3-hour chart displays a pattern resembling a bullish pennant breakout. If this breakout is confirmed, technical analysis suggests a potential price target of $4.71.
Trade ativo
Nota
Sometimes patterns morph into new patternsNota
New pattern same targetNota
Nota
Nota
Another new ATHNota
Agix and ocean are planning to merge with FetchAi.Nota
Nota
Bull markets are fun. Its meme and AI season.Nota
Trade ativo
Nota
There is lots of fud coming out regarding the agix, ocean, fetchai token consolidation. I’m just gonna double down on fet at the equilibrium around $2 if it falls there.Nota
Nota
I just can’t see a big correction just yet.Trade ativo
Trade ativo
Nota
Stop loss at $2.79.Trade fechado: stop atingido
Trade ativo
Strong bullish divergence on all time framesUSDT: 0xd3787d843Cf915E5475119459B34b6429827c297
Aviso legal
As informações e publicações não devem ser e não constituem conselhos ou recomendações financeiras, de investimento, de negociação ou de qualquer outro tipo, fornecidas ou endossadas pela TradingView. Leia mais em Termos de uso.
USDT: 0xd3787d843Cf915E5475119459B34b6429827c297
Aviso legal
As informações e publicações não devem ser e não constituem conselhos ou recomendações financeiras, de investimento, de negociação ou de qualquer outro tipo, fornecidas ou endossadas pela TradingView. Leia mais em Termos de uso.