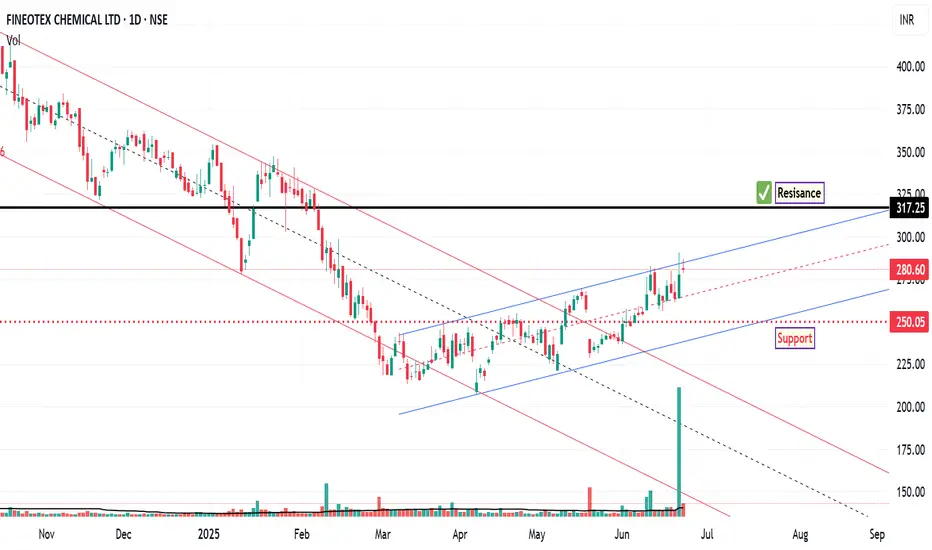
The chart of FCL outlines key price levels that represent potential breakout zones, signaling shifts in market momentum. It also identifies critical support areas where buying interest may emerge, offering insight into potential entry points.
Additionally, resistance zones are clearly marked, indicating probable barriers to upward price movement. These levels are instrumental in formulating strategic entry and exit decisions based on anticipated market behaviour.
Disclaimer:
This technical analysis is provided for informational and educational purposes only. It does not constitute financial advice or a recommendation to buy or sell any security. Investors should perform their own due diligence and consult with a licensed financial advisor before making any investment decisions.
Trade fechado: stop atingido
Setup Invalid, Trade CloseAviso legal
As informações e publicações não devem ser e não constituem conselhos ou recomendações financeiras, de investimento, de negociação ou de qualquer outro tipo, fornecidas ou endossadas pela TradingView. Leia mais em Termos de uso.
Aviso legal
As informações e publicações não devem ser e não constituem conselhos ou recomendações financeiras, de investimento, de negociação ou de qualquer outro tipo, fornecidas ou endossadas pela TradingView. Leia mais em Termos de uso.