🔍 Technical Context
Moving averages (20-day, 50-day) are showing price above them, which suggests bullish bias.
Oscillators: RSI ~ 59-60 meaning moderate strength.
A recent source says the daily summary is “Neutral” on investing.com, indicating caution.
1-day pivot levels (classic) from Investing.com:
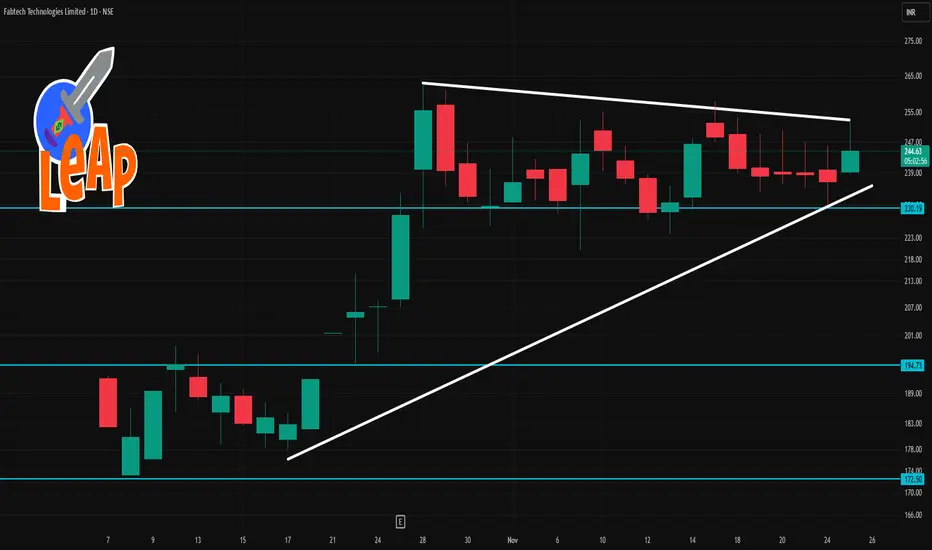
Pivot ~ ₹ 237.73
Resistance R1 ~ ₹ 240.46, R2 ~ ₹ 244.72, R3 ~ ₹ 247.45
Support S1 ~ ₹ 233.47, S2 ~ ₹ 230.74, S3 ~ ₹ 226.48
📊 Key Levels to Watch Today
Support Zone: ~ ₹ 233-235
If the stock approaches or dips into this area, watch for whether it holds or breaks.
Immediate Pivot / Mid-range: ~ ₹ 237-238
The pivot (~₹237.73) is a critical inflection point. A clear move above might bias upside; a break below may shift focus downward.
Resistance Zone: ~ ₹ 240-245
Upper resistance around ~₹240.46 to ~₹244.72. If momentum picks up and this zone is breached, next upside target ~₹247.45.
Lower Breakdown Level: ~ ₹ 230-227
If support in the ~233-235 zone fails, look toward ~₹230.74 and then ~₹226.48 as next real support.
Moving averages (20-day, 50-day) are showing price above them, which suggests bullish bias.
Oscillators: RSI ~ 59-60 meaning moderate strength.
A recent source says the daily summary is “Neutral” on investing.com, indicating caution.
1-day pivot levels (classic) from Investing.com:
Pivot ~ ₹ 237.73
Resistance R1 ~ ₹ 240.46, R2 ~ ₹ 244.72, R3 ~ ₹ 247.45
Support S1 ~ ₹ 233.47, S2 ~ ₹ 230.74, S3 ~ ₹ 226.48
📊 Key Levels to Watch Today
Support Zone: ~ ₹ 233-235
If the stock approaches or dips into this area, watch for whether it holds or breaks.
Immediate Pivot / Mid-range: ~ ₹ 237-238
The pivot (~₹237.73) is a critical inflection point. A clear move above might bias upside; a break below may shift focus downward.
Resistance Zone: ~ ₹ 240-245
Upper resistance around ~₹240.46 to ~₹244.72. If momentum picks up and this zone is breached, next upside target ~₹247.45.
Lower Breakdown Level: ~ ₹ 230-227
If support in the ~233-235 zone fails, look toward ~₹230.74 and then ~₹226.48 as next real support.
Publicações relacionadas
Aviso legal
As informações e publicações não se destinam a ser, e não constituem, conselhos ou recomendações financeiras, de investimento, comerciais ou de outro tipo fornecidos ou endossados pela TradingView. Leia mais nos Termos de Uso.
Publicações relacionadas
Aviso legal
As informações e publicações não se destinam a ser, e não constituem, conselhos ou recomendações financeiras, de investimento, comerciais ou de outro tipo fornecidos ou endossados pela TradingView. Leia mais nos Termos de Uso.