🔹 EUR/CHF Technical Analysis (1H Chart)
1. Current Market Structure
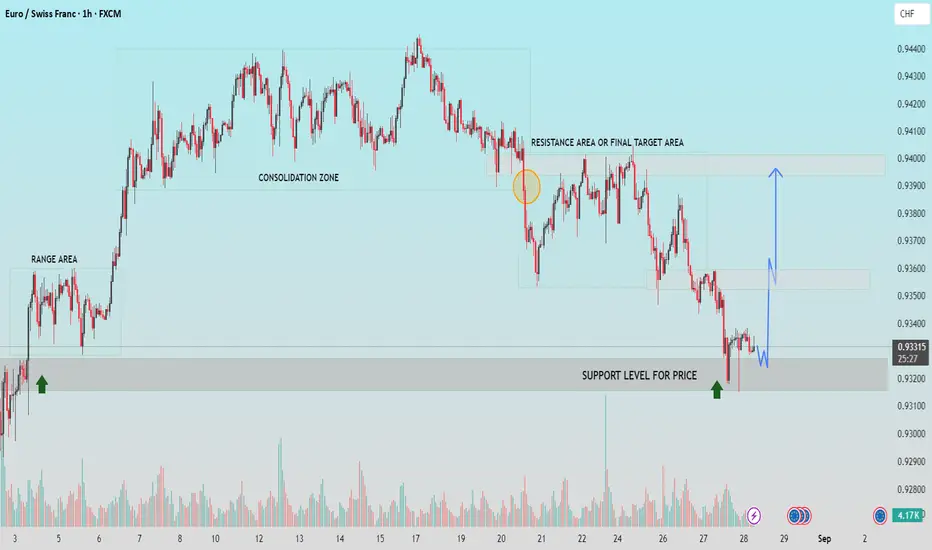
Price is consolidating near 0.9330 after a recent bearish move. The pair has tested the support level at 0.9320 – 0.9330, which has acted as a strong demand zone in previous sessions. Buyers have stepped in here multiple times, suggesting potential bullish interest.
2. Key Support Zone
Level: 0.9320 – 0.9330
This zone is critical for bulls to maintain control. If the price holds above this level, we could expect a bullish reversal. A breakdown below it, however, would indicate weakness and open the door for further downside.
3. Immediate Resistance Levels
* First Resistance: 0.9360
This is the initial barrier that price must break to confirm bullish momentum.
* Major Resistance (Final Target Area): 0.9390 – 0.9400
This is the top of the previous consolidation range and a strong supply zone where sellers are likely to re-enter the market.
4. Potential Scenarios
* Bullish Scenario: If price holds above 0.9330 and breaks 0.9360, expect a move toward 0.9390 – 0.9400.
* Bearish Scenario: A clear break below 0.9320 could push the pair lower toward the next demand zone.
5. Market Outlook & Bias
* Bias: Short-term bullish above 0.9330, targeting 0.9360 and then 0.9400.
* Invalidation: Break below 0.9320.
If this helpful for you, press the like button.
1. Current Market Structure
Price is consolidating near 0.9330 after a recent bearish move. The pair has tested the support level at 0.9320 – 0.9330, which has acted as a strong demand zone in previous sessions. Buyers have stepped in here multiple times, suggesting potential bullish interest.
2. Key Support Zone
Level: 0.9320 – 0.9330
This zone is critical for bulls to maintain control. If the price holds above this level, we could expect a bullish reversal. A breakdown below it, however, would indicate weakness and open the door for further downside.
3. Immediate Resistance Levels
* First Resistance: 0.9360
This is the initial barrier that price must break to confirm bullish momentum.
* Major Resistance (Final Target Area): 0.9390 – 0.9400
This is the top of the previous consolidation range and a strong supply zone where sellers are likely to re-enter the market.
4. Potential Scenarios
* Bullish Scenario: If price holds above 0.9330 and breaks 0.9360, expect a move toward 0.9390 – 0.9400.
* Bearish Scenario: A clear break below 0.9320 could push the pair lower toward the next demand zone.
5. Market Outlook & Bias
* Bias: Short-term bullish above 0.9330, targeting 0.9360 and then 0.9400.
* Invalidation: Break below 0.9320.
If this helpful for you, press the like button.
Trade ativo
Nota
1st target hit, set BE Trade fechado: objetivo atingido
💸FREE FOREX Signals in Telegram : t.me/FxInsightsHub0
🔹Join Our Telegram Channel, Pure Price Action Based Signals With Chart Analysis.
t.me/FxInsightsHub0
🚀FREE CRYPTO Signals In Telegram: t.me/FxInsightsHub0
🔹Join Our Telegram Channel, Pure Price Action Based Signals With Chart Analysis.
t.me/FxInsightsHub0
🚀FREE CRYPTO Signals In Telegram: t.me/FxInsightsHub0
Publicações relacionadas
Aviso legal
As informações e publicações não devem ser e não constituem conselhos ou recomendações financeiras, de investimento, de negociação ou de qualquer outro tipo, fornecidas ou endossadas pela TradingView. Leia mais em Termos de uso.