Ethereum (ETH/USDT)
Ethereum is moving at a similar pace to Bitcoin – showing heavy volatility and liquidation pressure, but there are also signs of accumulation near strong support.
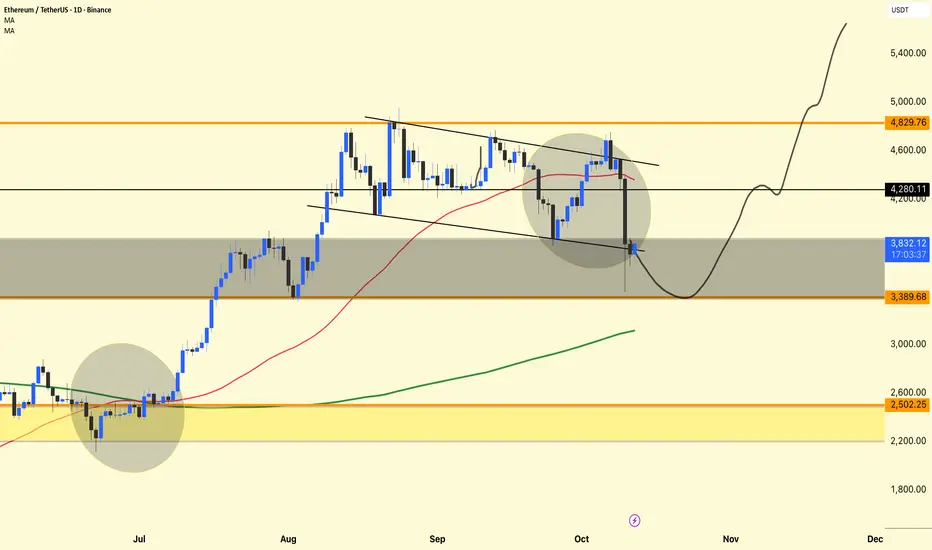
The chart shows a return to a key demand zone after a breakout failure from a descending wedge, followed by the formation of a potential reversal structure.
Descending Channel and Breakdown
ETH had been moving within a descending channel for several weeks.
Recently, it attempted a breakout, but sellers regained control, resulting in a false breakout and a retest rejection.
The candle's sharp decline through the red moving average (around $4,300) indicates that bulls were heavily liquidated.
However, the price saw buying interest around the $3,800–$3,400 area, which aligns with the chart's gray support area.
Moving Average Insights
Red MA (50-day): Currently acting as dynamic resistance; ETH needs a clear close above it to confirm a short-term bullish recovery.
Green MA (200-day): Still trending upwards, indicating that the long-term structure remains bullish despite near-term weakness.
If the price stabilizes above the 200-day MA, it will likely attract medium-term investors.
Current Price Activity
At $3,836, ETH is testing the lower boundary of the support zone.
The chart projection (curved black line) suggests:
A possible short-term retest towards $3,380,
Followed by a gradual recovery towards $4,200,
And then a potential continuation towards $4,800+ if momentum strengthens.
This pattern resembles a "spring" setup—a common accumulation behavior before a major reversal.
DYOR | NFA
Ethereum is moving at a similar pace to Bitcoin – showing heavy volatility and liquidation pressure, but there are also signs of accumulation near strong support.
The chart shows a return to a key demand zone after a breakout failure from a descending wedge, followed by the formation of a potential reversal structure.
Descending Channel and Breakdown
ETH had been moving within a descending channel for several weeks.
Recently, it attempted a breakout, but sellers regained control, resulting in a false breakout and a retest rejection.
The candle's sharp decline through the red moving average (around $4,300) indicates that bulls were heavily liquidated.
However, the price saw buying interest around the $3,800–$3,400 area, which aligns with the chart's gray support area.
Moving Average Insights
Red MA (50-day): Currently acting as dynamic resistance; ETH needs a clear close above it to confirm a short-term bullish recovery.
Green MA (200-day): Still trending upwards, indicating that the long-term structure remains bullish despite near-term weakness.
If the price stabilizes above the 200-day MA, it will likely attract medium-term investors.
Current Price Activity
At $3,836, ETH is testing the lower boundary of the support zone.
The chart projection (curved black line) suggests:
A possible short-term retest towards $3,380,
Followed by a gradual recovery towards $4,200,
And then a potential continuation towards $4,800+ if momentum strengthens.
This pattern resembles a "spring" setup—a common accumulation behavior before a major reversal.
DYOR | NFA
Publicações relacionadas
Aviso legal
As informações e publicações não devem ser e não constituem conselhos ou recomendações financeiras, de investimento, de negociação ou de qualquer outro tipo, fornecidas ou endossadas pela TradingView. Leia mais em Termos de uso.
Publicações relacionadas
Aviso legal
As informações e publicações não devem ser e não constituem conselhos ou recomendações financeiras, de investimento, de negociação ou de qualquer outro tipo, fornecidas ou endossadas pela TradingView. Leia mais em Termos de uso.