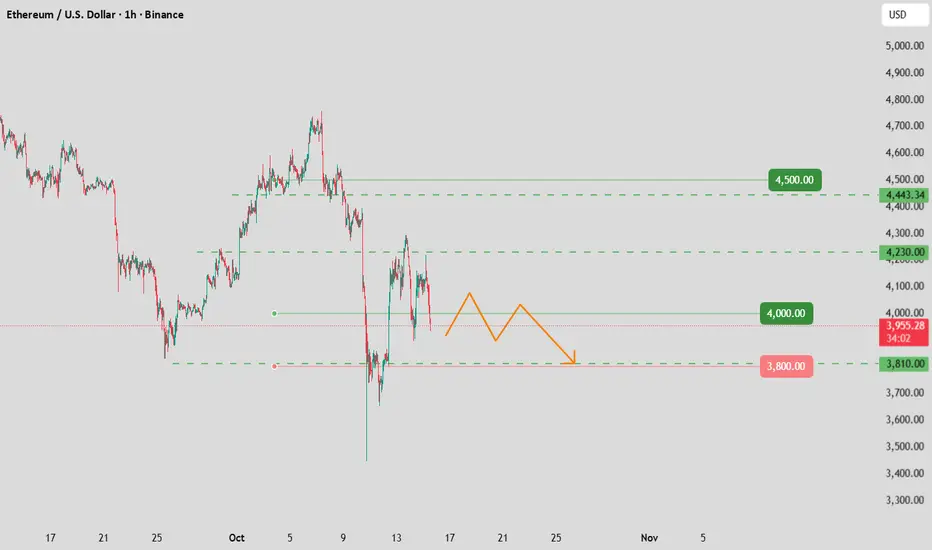
From a technical standpoint, Ethereum’s previous strong upward structure has been notably disrupted amid this pullback. The 1-hour K-line chart shows that after failing to break through the 4,788 high, ETH closed multiple consecutive long-bodied bearish candles. Its price has sequentially breached the MA5, MA20, and MA60 moving averages, marking a reversal in the short-term trend.
After the MACD indicator formed a "death cross" at a high level, the fast line has crossed below the zero line and entered the bearish zone. The green bearish momentum bars continue to expand, indicating that the short-term adjustment is not yet complete.
Today, Ethereum’s price is struggling to hold above the medium-term moving average. A break below this level could trigger a deeper decline.
Welcome to join my free channel for market updates: t.me/+EZspzjD8FT40YTY8
Daily update professional financial trading strategies: t.me/+6i-kmFunsMVkNzQ0
Let profitable trading become easier: t.me/+EZspzjD8FT40YTY8
Daily update professional financial trading strategies: t.me/+6i-kmFunsMVkNzQ0
Let profitable trading become easier: t.me/+EZspzjD8FT40YTY8
Publicações relacionadas
Aviso legal
As informações e publicações não devem ser e não constituem conselhos ou recomendações financeiras, de investimento, de negociação ou de qualquer outro tipo, fornecidas ou endossadas pela TradingView. Leia mais em Termos de uso.