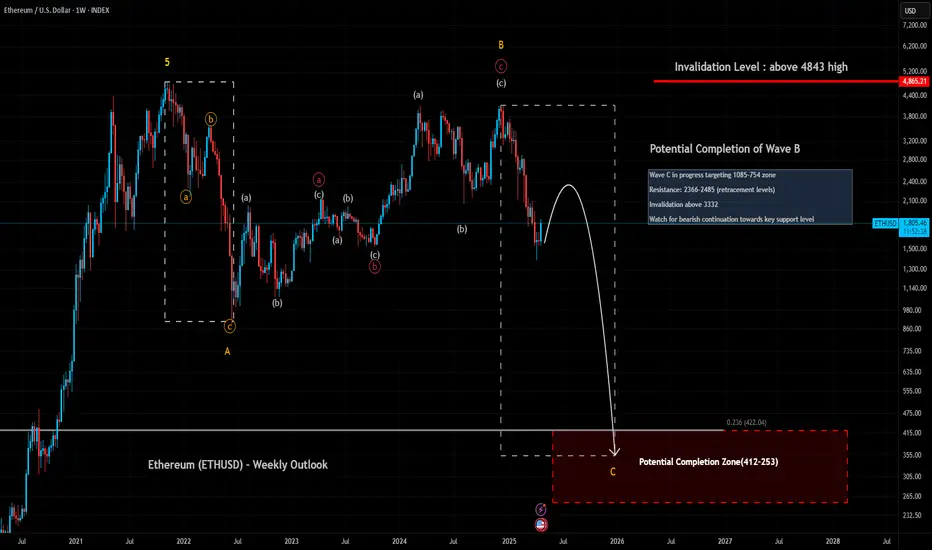
On the weekly chart, Ethereum appears to have completed a corrective Wave B inside the larger flat structure.
We are now monitoring the beginning stages of Wave C downward, following the major B top.
Immediate resistance levels are seen around $2366 and $2485 zones (0.5 and 0.618 retracement).
Key support is aligned with the $1085 level as the first major zone.
📈 For a broader context, please refer to my Monthly Ethereum analysis.
📉 For more tactical short-term entries, check my Daily Ethereum analysis.
#Ethereum #ETH #WeeklyChart #TechnicalAnalysis #ElliottWave #CryptoTrading #BearishScenario
Aviso legal
As informações e publicações não devem ser e não constituem conselhos ou recomendações financeiras, de investimento, de negociação ou de qualquer outro tipo, fornecidas ou endossadas pela TradingView. Leia mais em Termos de uso.
Aviso legal
As informações e publicações não devem ser e não constituem conselhos ou recomendações financeiras, de investimento, de negociação ou de qualquer outro tipo, fornecidas ou endossadas pela TradingView. Leia mais em Termos de uso.