September 11th - 5:50am EST
Yesterday, we did not get as much volatility as we have done in the past on economic data release days. Today, we have another with CPI at 8:30am. While we could continue the trend of low volatility, today I am still going to be cautious. Before I get into today's plan, take a minute to read my daily trade plan from yesterday. (See Related Publication Section)
I stated in the plan "Any flush of 6526 and reclaim should be a good level for a move higher. We could see price sell off all the way down to the white trend line around 6474 area, flush and then recover a level in blue to continue higher."
After the initial pop from the PPI release, we opened up battled between 6545-6562, then grinded lower after many attempts to lose 6545. I said, yesterday in my 10:29am Note:
"Price can still go higher, but any loss of 6545 would not be good and could flush lower. See my updates above on places I like for us to flush and reclaim at lower levels. 6526 being first for some points, maybe even getting as low as 6517 and reclaiming 6526."
At 3:20pm we touched the 6522 level and rallied up to 6543 into the close for a nice 20pt pop. While I was actually off my desk for this move, it shows you that with patience and waiting for the high-quality setups, you will be rewarded.
------------------------------------------------------------------------------------------------------------------
What is the plan for today? 8:30am, we have a big data report. I will not be trading before the report and will be waiting on price to settle out after the NYSE open. That is one of my rules on data & volatility events.
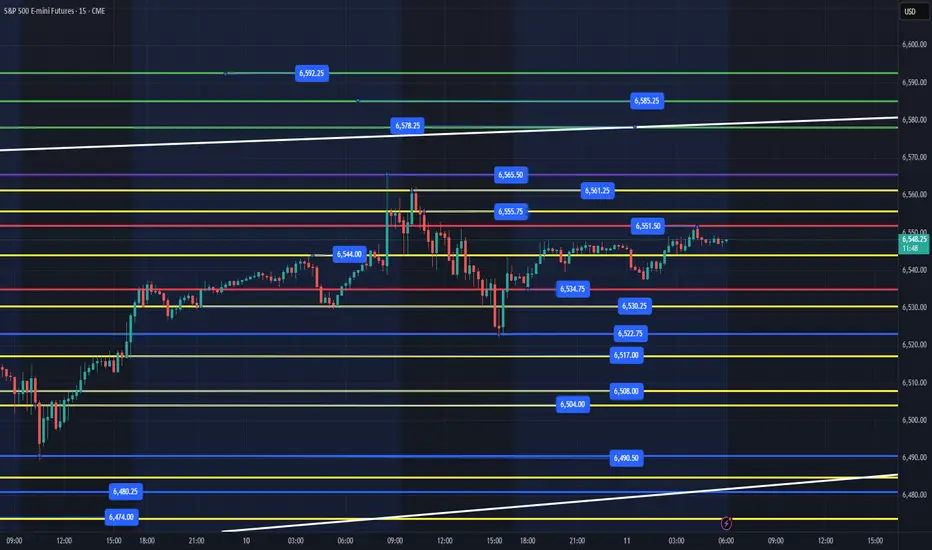
Overnight low is 6534 and high is 6551 as of writing. We have to remain bullish until proven otherwise, so the targets above at 6567, 6578 and if it really wants it can get to 6592. I have said that the white trend line is a magnet that we are heading towards. We just don't know what route price will take to achieve its targets. We focus on our process and edge to take points out of the market daily.
Key Support Levels - 6545, 6534, 6530, 6522, 6523, 6517, 6504-08, 6490, 6480
Key Resistance Levels - 6551, 6555, 6565, 6578, 6592
After the CPI release and by 9am, we should have a good sense for what price is looking to do. Any flush of 6534 or even better 6222 (maybe as low as 6517) and reclaim should be a good level for a move higher. We could see price sell off all the way down to the white trend line around 6480 area, flush and then recover a level in blue to continue higher.
IF, price does flush 6490 and we are accelerating into it, I would be patient and wait to see what it does. While yesterday we flushed, recovered for a nice 50 point move higher, we might get a nice bounce, but liquidity continues to be taken each time we visit this level and when we do lose the level, I anticipate a multi-level loss.
IF, price can flush and reclaim the red or blue levels, those are always my highest quality spots I am looking to ride higher. The yellow levels are very important support and resistance levels that you can get reclaims of and move higher. They can also be choppy and harder to enter without a short time frame edge for entry. It is all based on your strategy, goals and edge of getting points from ES.
Size down today, price could lose 100+pts or run 100+pts higher. Do not be a hero. Wait for your levels and edge to enter and make sure you take profits at the next level higher.
I will post updates after CPI and around 10am after NYSE has settled out.
-----------------------------------------------------------------------------------------------------------------
Couple of things about how I color code my levels.
1. Purple shows the weekly High/Low
2. Red shows the current overnight session High/Low (time of post)
3. Blue shows the previous day's session Low (also other previous day's lows)
4. Yellow Levels are levels that show support and resistance levels of interest.
5. White shows the trendline from the August lows.
Yesterday, we did not get as much volatility as we have done in the past on economic data release days. Today, we have another with CPI at 8:30am. While we could continue the trend of low volatility, today I am still going to be cautious. Before I get into today's plan, take a minute to read my daily trade plan from yesterday. (See Related Publication Section)
I stated in the plan "Any flush of 6526 and reclaim should be a good level for a move higher. We could see price sell off all the way down to the white trend line around 6474 area, flush and then recover a level in blue to continue higher."
After the initial pop from the PPI release, we opened up battled between 6545-6562, then grinded lower after many attempts to lose 6545. I said, yesterday in my 10:29am Note:
"Price can still go higher, but any loss of 6545 would not be good and could flush lower. See my updates above on places I like for us to flush and reclaim at lower levels. 6526 being first for some points, maybe even getting as low as 6517 and reclaiming 6526."
At 3:20pm we touched the 6522 level and rallied up to 6543 into the close for a nice 20pt pop. While I was actually off my desk for this move, it shows you that with patience and waiting for the high-quality setups, you will be rewarded.
------------------------------------------------------------------------------------------------------------------
What is the plan for today? 8:30am, we have a big data report. I will not be trading before the report and will be waiting on price to settle out after the NYSE open. That is one of my rules on data & volatility events.
Overnight low is 6534 and high is 6551 as of writing. We have to remain bullish until proven otherwise, so the targets above at 6567, 6578 and if it really wants it can get to 6592. I have said that the white trend line is a magnet that we are heading towards. We just don't know what route price will take to achieve its targets. We focus on our process and edge to take points out of the market daily.
Key Support Levels - 6545, 6534, 6530, 6522, 6523, 6517, 6504-08, 6490, 6480
Key Resistance Levels - 6551, 6555, 6565, 6578, 6592
After the CPI release and by 9am, we should have a good sense for what price is looking to do. Any flush of 6534 or even better 6222 (maybe as low as 6517) and reclaim should be a good level for a move higher. We could see price sell off all the way down to the white trend line around 6480 area, flush and then recover a level in blue to continue higher.
IF, price does flush 6490 and we are accelerating into it, I would be patient and wait to see what it does. While yesterday we flushed, recovered for a nice 50 point move higher, we might get a nice bounce, but liquidity continues to be taken each time we visit this level and when we do lose the level, I anticipate a multi-level loss.
IF, price can flush and reclaim the red or blue levels, those are always my highest quality spots I am looking to ride higher. The yellow levels are very important support and resistance levels that you can get reclaims of and move higher. They can also be choppy and harder to enter without a short time frame edge for entry. It is all based on your strategy, goals and edge of getting points from ES.
Size down today, price could lose 100+pts or run 100+pts higher. Do not be a hero. Wait for your levels and edge to enter and make sure you take profits at the next level higher.
I will post updates after CPI and around 10am after NYSE has settled out.
-----------------------------------------------------------------------------------------------------------------
Couple of things about how I color code my levels.
1. Purple shows the weekly High/Low
2. Red shows the current overnight session High/Low (time of post)
3. Blue shows the previous day's session Low (also other previous day's lows)
4. Yellow Levels are levels that show support and resistance levels of interest.
5. White shows the trendline from the August lows.
Nota
8:50am - UpdateIF, price can clear 6555, we should continue higher. We now need to hold 6535 on any dip. IF, we can clear 6555, but end up failing and then price reverse back below 6535, I would get out the way and wait for a flush of 6522 (maybe 6517) for a bounce. IF, we fall below 6504, I would be careful at the 6490 level. While we could get a bounce, it has been used up all week and not sure how much is left in the tank. Below 6490 and we could flush down pretty fast. So be careful.
Nota
10am - Update Price has held the 6550 level you can see clearly on the 15 min chart. Heading towards the white trend line magnet. I would NOT be chasing this and would be taking profits around 6570-75. IF, price can't hold 6550, We could accelerate lower. IF, price does accelerate lower, I would get out the way. IF, price slowly grinds down into the 6535 level, I would look for a flush and reclaim for a back test of 6547-50. All other levels below are still in play to flush and reclaim. Remember, IF, ES sells off quickly (30+ points in 5 mins type fast), it won't just snap back (most of the time), you need to be patient and watch price action for clues it's found a short-term low.
Nota
10:50am - Update - Session Volume Profile currently sits at 6574. We hit the 6578 & 6585 targets. 6592 is still potential, but I would be careful here as we have had some chasing since the open. Can price continue higher? Sure, it can. Institutions will determine when they want prices to go lower, and a rug pull can happen at any time. IF, we lose 6574 I would be cautious. IF, we can't hold 6550, don't be a hero and try to pick a bottom. Have patience and see what price is doing. This has been a nice run above 6555 and no reason to take unnecessary risk, IMO. I got 10pts from the 6555 level and I am only interested in longing again at the 6535 level or below based on my trade plan. So, if price stays above that level all day, I won't have an entry based on my trading edge and will not be trading until price comes back to my lower levels. Publicações relacionadas
Aviso legal
As informações e publicações não se destinam a ser, e não constituem, conselhos ou recomendações financeiras, de investimento, comerciais ou de outro tipo fornecidos ou endossados pela TradingView. Leia mais nos Termos de Uso.
Publicações relacionadas
Aviso legal
As informações e publicações não se destinam a ser, e não constituem, conselhos ou recomendações financeiras, de investimento, comerciais ou de outro tipo fornecidos ou endossados pela TradingView. Leia mais nos Termos de Uso.