Overview: let's review our expectations on the update of yesterday:
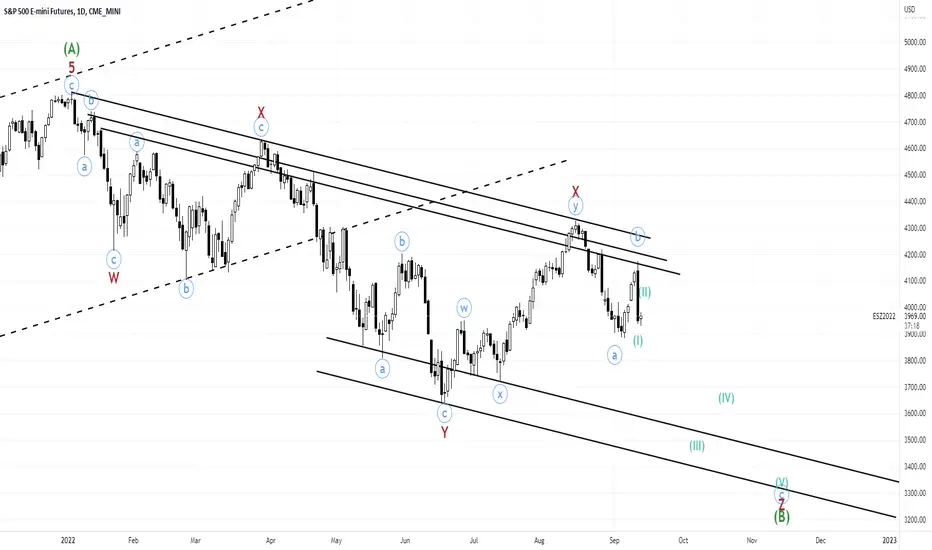
Update: Today we made lower low than yesterday daily candle, but both times it lead to strong bounces. Looking at the hourly chart, I think we have completed wave (I) and wave (II) is actually developing as a flat, with its wave b also as a flat. What follows is the continuation of the rally to complete wave c of (II) and then bear elevator comes with wave (III).

Potential target for wave (II) peak? (3994.25-4017.25)
1) Retracement of wave (I): 3994.25, 4017.25, and 4028.75
2) Volume profile of wave (I): 3995.75 (VAL) and 4004 (VPOC)
- Looking at the hourly chart, I believe today we completed waves a and b of (I) of c and wave c of (I) follows before we see a bounce as wave (II).
- Note that the drop caused by CPI news happened in a one-minute candle, which makes it impossible to see its subwaves and decide on its wave degree.
- Is it possible that we have actually completed wave (I) today and we bounce as wave (II) at this point? yes
Update: Today we made lower low than yesterday daily candle, but both times it lead to strong bounces. Looking at the hourly chart, I think we have completed wave (I) and wave (II) is actually developing as a flat, with its wave b also as a flat. What follows is the continuation of the rally to complete wave c of (II) and then bear elevator comes with wave (III).
Potential target for wave (II) peak? (3994.25-4017.25)
1) Retracement of wave (I): 3994.25, 4017.25, and 4028.75
2) Volume profile of wave (I): 3995.75 (VAL) and 4004 (VPOC)
Publicações relacionadas
Aviso legal
As informações e publicações não devem ser e não constituem conselhos ou recomendações financeiras, de investimento, de negociação ou de qualquer outro tipo, fornecidas ou endossadas pela TradingView. Leia mais em Termos de uso.
Publicações relacionadas
Aviso legal
As informações e publicações não devem ser e não constituem conselhos ou recomendações financeiras, de investimento, de negociação ou de qualquer outro tipo, fornecidas ou endossadas pela TradingView. Leia mais em Termos de uso.