The S&P 500 has experienced notably choppy price action over the past 60 days following the Federal Reserve’s rate cut. Many large-cap stocks most notably Nvidia, which saw a substantial rally have provided attractive profit-taking opportunities. Since then, the broader market has been trading sideways and, more specifically, within a local downtrend over the last 30 days.
From an Elliott Wave perspective, this pullback may be unfolding as a complex WXY corrective structure. A WXY pattern is essentially a series of connected ABC corrections each consisting of a three-wave “measured moves" that collectively form a more drawn-out and often more intricate consolidation phase. These moves can be mathematically projected using fibonacci.
The purpose of such a correction is typically to cool off the market after an extended rally. This cooling phase can manifest as a meaningful price decline, a time-based consolidation, or a combination of both. Ultimately, it allows market sentiment to reset and establishes a balanced range from which a stronger, more sustainable breakout can occur.
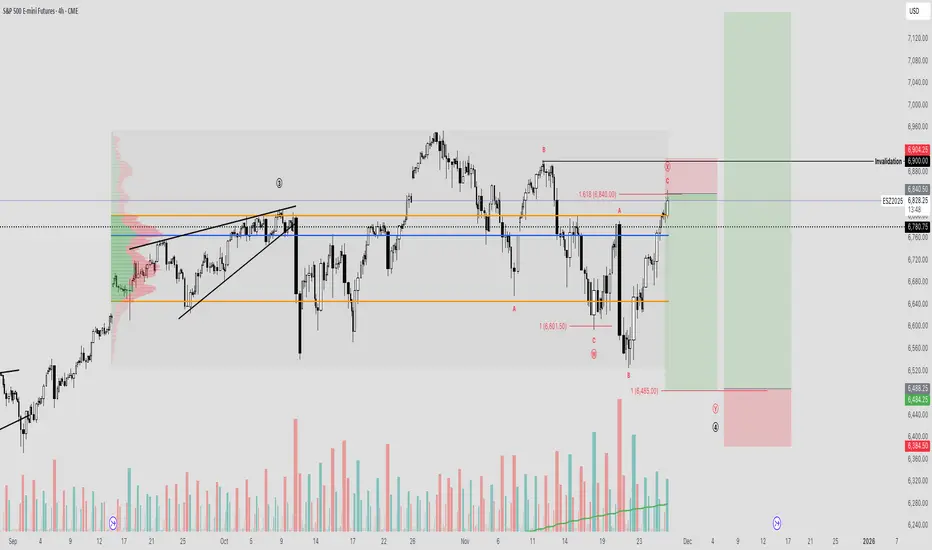
The main point of uncertainty lies in whether the W wave has been correctly identified. The subsequent X wave appears to form an expanding flat structure composed of three waves, ending with an impulsive move that taps the 1.618 extension—aligning well with typical Fibonacci market mathematics.
If a final Y-wave leg lower is still ahead, we have a clearly defined 1% invalidation level. Below that, a deeper sweep of the previous low becomes possible, allowing us to draw a trend-based Fibonacci extension from the W and X pivots to project a potential termination point for wave Y.
I’ll be closely monitoring this lower region, as it could present an excellent buying opportunity—one that could position the market for significantly higher upside targets and, at minimum, a retest or sweep of the current all-time highs.
From an Elliott Wave perspective, this pullback may be unfolding as a complex WXY corrective structure. A WXY pattern is essentially a series of connected ABC corrections each consisting of a three-wave “measured moves" that collectively form a more drawn-out and often more intricate consolidation phase. These moves can be mathematically projected using fibonacci.
The purpose of such a correction is typically to cool off the market after an extended rally. This cooling phase can manifest as a meaningful price decline, a time-based consolidation, or a combination of both. Ultimately, it allows market sentiment to reset and establishes a balanced range from which a stronger, more sustainable breakout can occur.
The main point of uncertainty lies in whether the W wave has been correctly identified. The subsequent X wave appears to form an expanding flat structure composed of three waves, ending with an impulsive move that taps the 1.618 extension—aligning well with typical Fibonacci market mathematics.
If a final Y-wave leg lower is still ahead, we have a clearly defined 1% invalidation level. Below that, a deeper sweep of the previous low becomes possible, allowing us to draw a trend-based Fibonacci extension from the W and X pivots to project a potential termination point for wave Y.
I’ll be closely monitoring this lower region, as it could present an excellent buying opportunity—one that could position the market for significantly higher upside targets and, at minimum, a retest or sweep of the current all-time highs.
Nota
In terms of fundamentals, majority of this rally has come from the re-pricing of a fed rate cut in December to 83% , as well as the news of a new FED chair who would be much more accommodative for the market. Given that next Friday there is major CORE PCE inflation data being released, as well as personal spending, the market could see volatility that can potentially lead to the un-pricing of the rate cut, or at minimum a 50%-50% chance leading into the Dec 10th announcement. Nota
Something I will also consider, if this pattern materializes with symmetry-the Fibonacci time is pointing to a pivot around Monday Dec 8th. Trade ativo
Short trade takenNota
An additional confluence is a potential Bearish Cypher pattern as well Aviso legal
As informações e publicações não se destinam a ser, e não constituem, conselhos ou recomendações financeiras, de investimento, comerciais ou de outro tipo fornecidos ou endossados pela TradingView. Leia mais nos Termos de Uso.
Aviso legal
As informações e publicações não se destinam a ser, e não constituem, conselhos ou recomendações financeiras, de investimento, comerciais ou de outro tipo fornecidos ou endossados pela TradingView. Leia mais nos Termos de Uso.