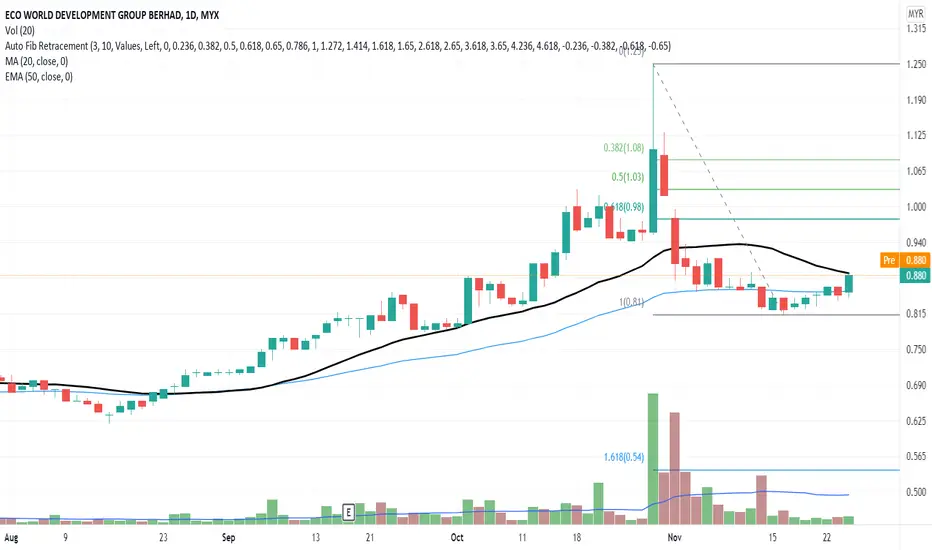
Using Fibonacci Retracement (FIBO) chart, the price indicates a continuous price uptrend momentum from the support line.
MACD and OBV charts indicate an early sign of divergence signal.
Therefore, it is in a good position to buy since it is below-the-market order and waits for the next significant price movement. Hence minimum the exposure risk from buying at peak price.
Put ECOWLD to your WL and watch out for significant price movement with volume or after the candlestick body crosses the MA20 line.
R 0.885
S 0.840
Publicações relacionadas
Aviso legal
As informações e publicações não devem ser e não constituem conselhos ou recomendações financeiras, de investimento, de negociação ou de qualquer outro tipo, fornecidas ou endossadas pela TradingView. Leia mais em Termos de uso.
Publicações relacionadas
Aviso legal
As informações e publicações não devem ser e não constituem conselhos ou recomendações financeiras, de investimento, de negociação ou de qualquer outro tipo, fornecidas ou endossadas pela TradingView. Leia mais em Termos de uso.