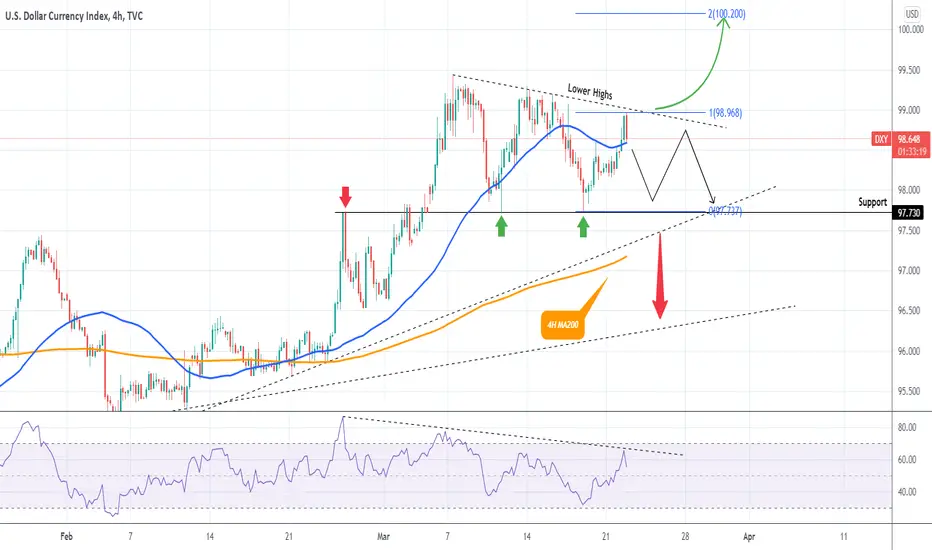
The U.S. Dollar Index just got rejected on the current 4H candle on the Lower Highs trend-line that started on the March 07 High. As long as this holds, the price should drop towards the 97.730 Support, which has already held twice, thus creating a Triangle pattern.
A break below the 4H MA200 (orange trend-line) justifies further selling towards the Lower Higher Lows trend-line (dashed), while a break above the Triangle's Lower Highs, is a break-out buy signal with a target the 2.0 Fibonacci extension (100.200).
--------------------------------------------------------------------------------------------------------
** Please support this idea with your likes and comments, it is the best way to keep it relevant and support me. **
--------------------------------------------------------------------------------------------------------
👑Best Signals (Forex/Crypto+70% accuracy) & Account Management (+20% profit/month on 10k accounts)
💰Free Channel t.me/tradingshotglobal
🤵Contact info@tradingshot.com t.me/tradingshot
🔥New service: next X100 crypto GEMS!
💰Free Channel t.me/tradingshotglobal
🤵Contact info@tradingshot.com t.me/tradingshot
🔥New service: next X100 crypto GEMS!
Aviso legal
As informações e publicações não se destinam a ser, e não constituem, conselhos ou recomendações financeiras, de investimento, comerciais ou de outro tipo fornecidos ou endossados pela TradingView. Leia mais nos Termos de Uso.