DXY – Monthly Elliott Wave Analysis | Major Support Test Ahead - DEC 2025
Previous Analysis: https://in.tradingview.com/chart/DXY/IFfI0KeQ-DXY-MONTHLY-ANALYSIS-01-JUL-2025-96-75/
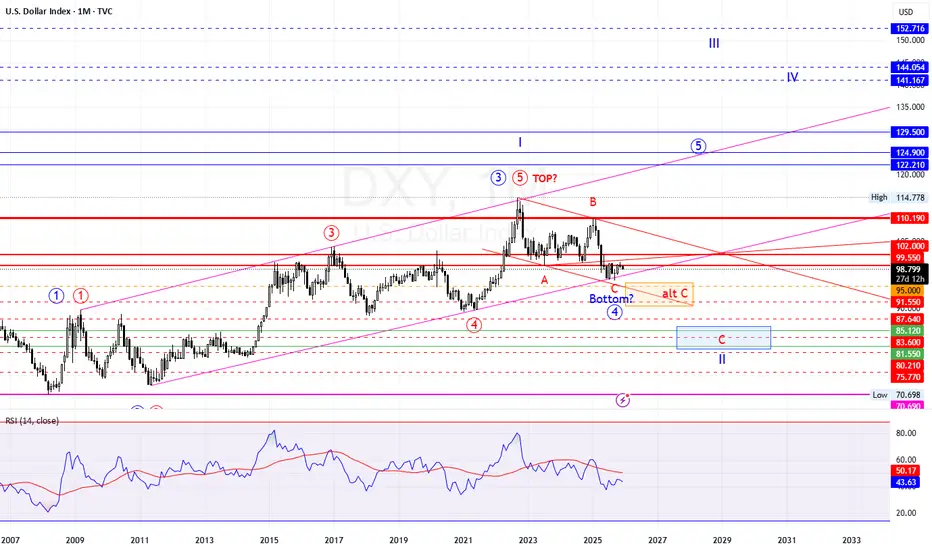
The US Dollar Index (DXY) appears to be completing a major corrective (A-B-C) structure after topping around 114.78, which is potentially the Wave ⑤ top of a long-term cycle. The index has retraced significantly and is now testing an important support zone that will determine the next long-term direction.
📍 Key Technical Highlights
🔹 Wave ⑤ Top: Formed near 114.78
🔹 Completed Wave A & B, currently in Wave C decline
🔹 Price retesting long-term trendline and Fib support area
🔹 Possible Wave (4) bottom in progress – confirmation pending
📈 Key Resistance Levels
Level Description
99.55 Immediate rejection zone
102.00 Major breakout confirmation
110.19 Strong structural resistance
114.78 Previous cycle high
📉 Key Support / C-Wave Target Zone
Support Range Notes
91.55 – 90.65 Near-term support
87.64 Structural support
83.60 – 81.55 High-probability Wave C completion zone
75.77 – 70.69 Extreme correction scenario
🔍 RSI Observation
RSI forming bullish divergence
Testing long-term support trend from 2008-2011 lows
Indicates downtrend exhaustion signs, but needs confirmation
Scenario Outlook
🟥 Bearish Continuation Preferred
As long as 99.55 – 102.00 holds as resistance,
➡️ Probability favors continuation lower into 83–81 zone to complete Wave II
🟩 Bullish Breakout Invalidates
A monthly close above 102.00
➡️ Could signal trend reversal targeting:
110.19
122.21
129.50
even 152+ in Wave III
Conclusion
📌 Long-term correction likely not finished
📌 Major bottom expected in 83–81 region unless 102 breaks
📌 Wave II final stage approaching – watch price action closely
Disclaimer
Elliott Wave analysis for educational purposes only. Not financial advice. Trade with proper risk management.
#dxy #usdx #dollarindex #dollar #index #indexes #indices #usd #eur #eurusd #fiber #currency #currencies
Previous Analysis: https://in.tradingview.com/chart/DXY/IFfI0KeQ-DXY-MONTHLY-ANALYSIS-01-JUL-2025-96-75/
The US Dollar Index (DXY) appears to be completing a major corrective (A-B-C) structure after topping around 114.78, which is potentially the Wave ⑤ top of a long-term cycle. The index has retraced significantly and is now testing an important support zone that will determine the next long-term direction.
📍 Key Technical Highlights
🔹 Wave ⑤ Top: Formed near 114.78
🔹 Completed Wave A & B, currently in Wave C decline
🔹 Price retesting long-term trendline and Fib support area
🔹 Possible Wave (4) bottom in progress – confirmation pending
📈 Key Resistance Levels
Level Description
99.55 Immediate rejection zone
102.00 Major breakout confirmation
110.19 Strong structural resistance
114.78 Previous cycle high
📉 Key Support / C-Wave Target Zone
Support Range Notes
91.55 – 90.65 Near-term support
87.64 Structural support
83.60 – 81.55 High-probability Wave C completion zone
75.77 – 70.69 Extreme correction scenario
🔍 RSI Observation
RSI forming bullish divergence
Testing long-term support trend from 2008-2011 lows
Indicates downtrend exhaustion signs, but needs confirmation
Scenario Outlook
🟥 Bearish Continuation Preferred
As long as 99.55 – 102.00 holds as resistance,
➡️ Probability favors continuation lower into 83–81 zone to complete Wave II
🟩 Bullish Breakout Invalidates
A monthly close above 102.00
➡️ Could signal trend reversal targeting:
110.19
122.21
129.50
even 152+ in Wave III
Conclusion
📌 Long-term correction likely not finished
📌 Major bottom expected in 83–81 region unless 102 breaks
📌 Wave II final stage approaching – watch price action closely
Disclaimer
Elliott Wave analysis for educational purposes only. Not financial advice. Trade with proper risk management.
#dxy #usdx #dollarindex #dollar #index #indexes #indices #usd #eur #eurusd #fiber #currency #currencies
Aviso legal
As informações e publicações não se destinam a ser, e não constituem, conselhos ou recomendações financeiras, de investimento, comerciais ou de outro tipo fornecidos ou endossados pela TradingView. Leia mais nos Termos de Uso.
Aviso legal
As informações e publicações não se destinam a ser, e não constituem, conselhos ou recomendações financeiras, de investimento, comerciais ou de outro tipo fornecidos ou endossados pela TradingView. Leia mais nos Termos de Uso.