📊 DXY Technical Outlook 💵
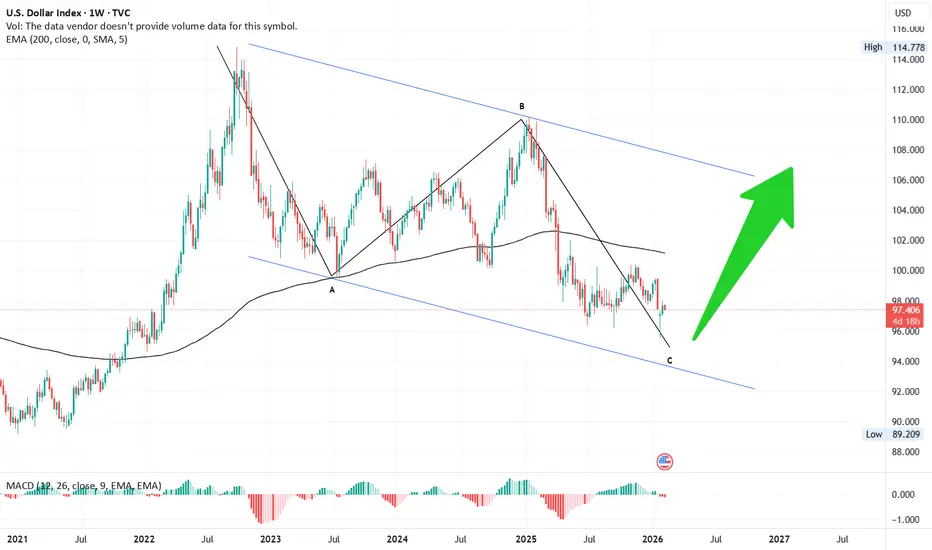
On 26 Sep 2022, the Dollar Index (DXY) began a weekly correction. What followed was a clear 5-wave decline, bottoming at 99.75 on 17 Jul 2023 — marking the completion of Wave A.
From there, the index rallied in 3 waves, reaching a high of 110 on 23 Dec 2024, forming Wave B. Currently, the C wave decline looks nearly complete as of 26 Jan, with price also testing the 200 EMA on the monthly chart.
⚡ Key Signal to Watch:
If DXY crosses above 100, it could signal the start of a new bull cycle, with potential upside targets in the 110–120 range.
🔑 Takeaway:
The structure suggests a zig-zag correction is unfolding, and the next move could define the dollar’s medium-term trend.
TechnicalAnalysis #DXY #Forex #TradingInsights #MarketOutlook
Publicações relacionadas
Aviso legal
As informações e publicações não se destinam a ser, e não constituem, conselhos ou recomendações financeiras, de investimento, comerciais ou de outro tipo fornecidos ou endossados pela TradingView. Leia mais nos Termos de Uso.
Publicações relacionadas
Aviso legal
As informações e publicações não se destinam a ser, e não constituem, conselhos ou recomendações financeiras, de investimento, comerciais ou de outro tipo fornecidos ou endossados pela TradingView. Leia mais nos Termos de Uso.