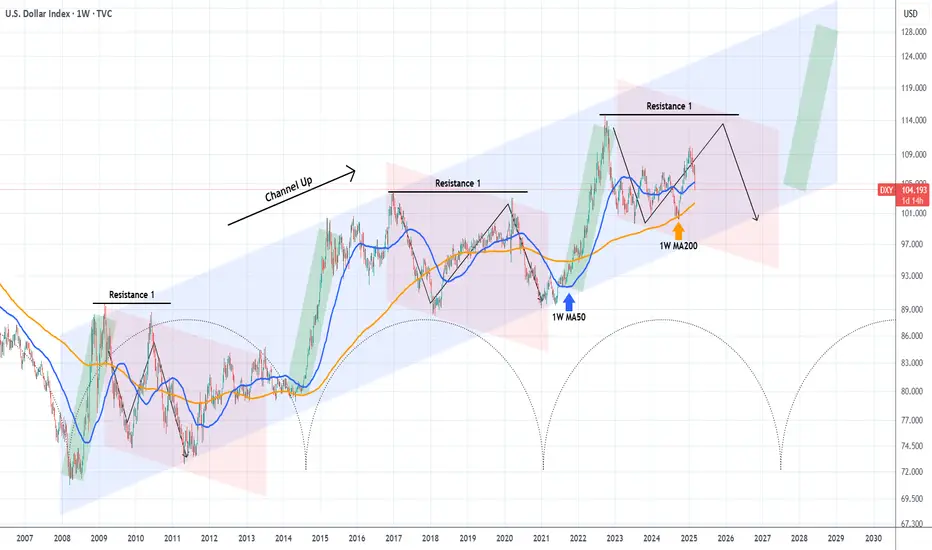
The U.S. Dollar index (DXY) has been on a strong decline recently, having even broken below its 1W MA50 (blue trend-line).
The multi-year trend is however bullish, a Channel Up pattern since the 2008 market bottom. With the use of the time Cycles tool, we can estimate when the next Bullish Leg starts, and that's not before 2027.
Based on the previous Channel Up corrections (red Channels) we should be expecting one final push towards Resistance 1, before a long-term decline and completion of the Bearish Leg.
As a result, as long as the 1W MA200 (orange trend-line) holds, we can take a low risk buy and target the 112.000 - 114.000 Zone.
-------------------------------------------------------------------------------
** Please LIKE 👍, FOLLOW ✅, SHARE 🙌 and COMMENT ✍ if you enjoy this idea! Also share your ideas and charts in the comments section below! This is best way to keep it relevant, support us, keep the content here free and allow the idea to reach as many people as possible. **
-------------------------------------------------------------------------------
💸💸💸💸💸💸
👇 👇 👇 👇 👇 👇
👑Best Signals (Forex/Crypto+70% accuracy) & Account Management (+20% profit/month on 10k accounts)
💰Free Channel t.me/tradingshotglobal
🤵Contact info@tradingshot.com t.me/tradingshot
🔥New service: next X100 crypto GEMS!
💰Free Channel t.me/tradingshotglobal
🤵Contact info@tradingshot.com t.me/tradingshot
🔥New service: next X100 crypto GEMS!
Aviso legal
As informações e publicações não devem ser e não constituem conselhos ou recomendações financeiras, de investimento, de negociação ou de qualquer outro tipo, fornecidas ou endossadas pela TradingView. Leia mais em Termos de uso.