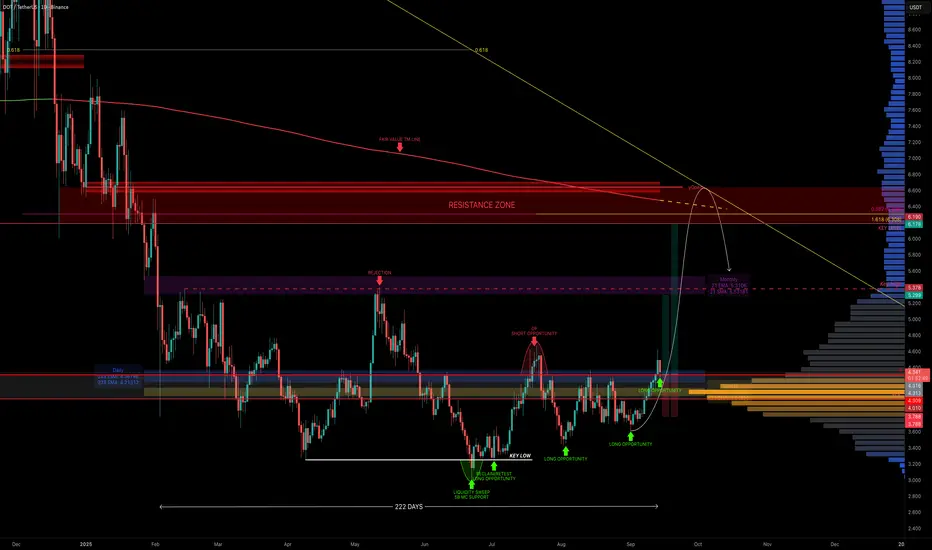
DOT has been in sideways chop for 222 days, but things are finally getting interesting. Price is now sitting above the yearly level ($4.309), the daily 233 EMA/SMA, and the weekly 21 EMA/SMA. Even better, it reclaimed the POC of the entire 222-day range.

Why $4 Is So Important
That’s a whole lot of support stacked at one zone.

Where It Gets Exciting (Targets)
First major target is the monthly 21 EMA/SMA ($5.3–$5.5), which also lines up with the range highs. That’s the first real test. The swing target zone sits around $6–$6.5, with multiple layers of confluence:
📌 This creates a solid resistance cluster between $6–$6.6, ideal for taking profits and potentially looking for shorts.
🟢 Long Trade Idea
Key Levels
🔍 Indicators used
➡️ Available for free. You can find it on my profile under “Scripts” and apply it directly to your charts for extra confluence when planning your trades.
_________________________________
💬 If you found this helpful, drop a like and comment!
Why $4 Is So Important
- Yearly level → $4.309
- Daily 233 EMA → $4.37 / Daily 233 SMA → $4.21
- Weekly 21 EMA → $4.15 / Weekly 21 SMA → $4.05
- POC of 222-day range → $4
- 0.618 Fib retracement (current move) → $4
That’s a whole lot of support stacked at one zone.
Where It Gets Exciting (Targets)
First major target is the monthly 21 EMA/SMA ($5.3–$5.5), which also lines up with the range highs. That’s the first real test. The swing target zone sits around $6–$6.5, with multiple layers of confluence:
- Key Level → ~$6
- Fair Value Trend Model Line → ~$6.5
- 0.382 Fib retracement of the downtrend → ~$6.19
- 0.618 Fib speed fan → ~$6.2 (October projection)
- 1.618 trend-based Fib extension → $6.308
- Market Cap Confluence: 10B market cap at $6.18
- Yearly Open: $6.642 → the overall target and an additional layer of resistance
📌 This creates a solid resistance cluster between $6–$6.6, ideal for taking profits and potentially looking for shorts.
🟢 Long Trade Idea
- Entry: Ladder longs from $4.36 down to $4
- Stop: Below $4 (clear invalidation)
- Take Profit: If $4 holds, DOT’s path is clear: first stop $5.3-$5.5, then $6.0–$6.6 as the macro target with the yearly open at $6.642 marking the final resistance.
Key Levels
- Support → $4.36–$4
- Resistance → $5.3–$5.5, then $6.2–$6.6 (10B market cap $6.18 + yearly open $6.642)
🔍 Indicators used
- LuxAlgo — Liquidity Sentiment Profile (Auto-Anchored)
- DriftLine — Pivot Open Zones [SiDec] → For identifying key yearly/monthly/weekly/daily opens that act as major S/R reference points
- Multi Timeframe 8x MA Support Resistance Zones [SiDec] → to identify support and resistance zones such as the monthly 21 EMA/SMA.
- Fair Value Trend Model [SiDec] → Calculates a regression-based fair value curve
➡️ Available for free. You can find it on my profile under “Scripts” and apply it directly to your charts for extra confluence when planning your trades.
_________________________________
💬 If you found this helpful, drop a like and comment!
Nota
DOT Update — Battling to Reclaim the Yearly LevelDOT lost the yearly level as support but quickly found footing at the 0.5 Fib retracement ($4.119) from the $3.6 swing low. As mentioned earlier in the comments, the $4.1 zone was the ideal long entry, backed by multiple layers of confluence:
→ 0.5 Fib retracement at $4.119
→ Weekly level at $4.11
→ Anchored VWAP from the $3.612 swing low aligning right on the weekly level
→ 0.618 Fib speed fan just below as extra support
Price has reacted well from this zone, but the current obstacle is the anchored VWAP from the $4.626 swing high, sitting close to the yearly level.
📌 For DOT to continue higher, it needs a clean break and retest of the yearly level to confirm bullish momentum.
Trade fechado manualmente
Exited this trade after spotting heavy selling, $4.12 acted as S/R level.🏆 Mastering Fibonacci for precision trading
🔹 Sharing high-probability trade setups
⚡ Unlock the power of technical analysis!
🔹 Sharing high-probability trade setups
⚡ Unlock the power of technical analysis!
Publicações relacionadas
Aviso legal
As informações e publicações não devem ser e não constituem conselhos ou recomendações financeiras, de investimento, de negociação ou de qualquer outro tipo, fornecidas ou endossadas pela TradingView. Leia mais em Termos de uso.
🏆 Mastering Fibonacci for precision trading
🔹 Sharing high-probability trade setups
⚡ Unlock the power of technical analysis!
🔹 Sharing high-probability trade setups
⚡ Unlock the power of technical analysis!
Publicações relacionadas
Aviso legal
As informações e publicações não devem ser e não constituem conselhos ou recomendações financeiras, de investimento, de negociação ou de qualquer outro tipo, fornecidas ou endossadas pela TradingView. Leia mais em Termos de uso.