US30 all set to fall 5% starting 18-23rd Oct
Here’s a summary of the chart you provided:
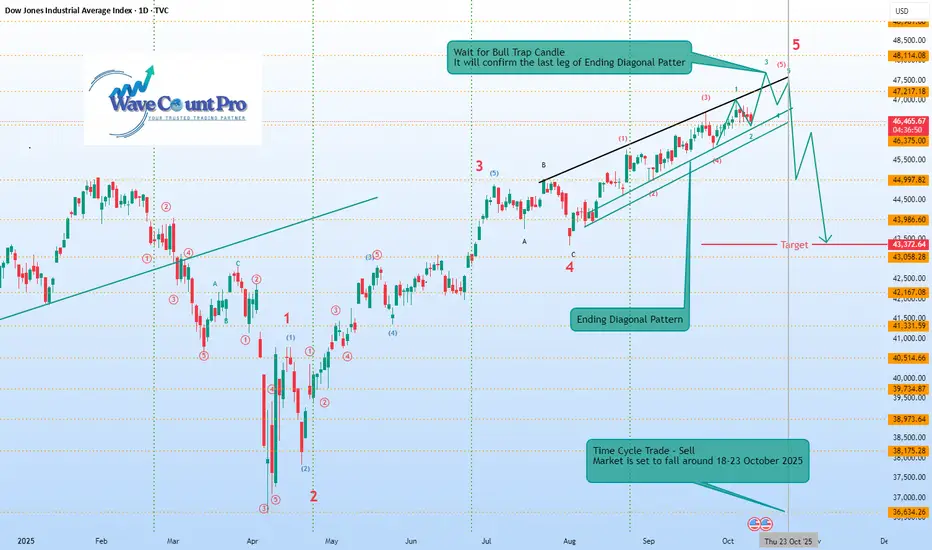
Index: Dow Jones Industrial Average (DJIA), Daily timeframe (2025).
Pattern: Ending Diagonal Pattern forming in Wave 5.
Wave Count:
Major impulse structure labeled 1–5, with sub-waves marked inside the Ending Diagonal.
Current move is in the final 5th wave, nearing completion.
Key Message:
A Bull Trap Candle is expected — it will confirm the final leg of the Ending Diagonal.
After that, a sharp correction (sell-off) is anticipated.
Target Zone: Around 43,372–43,058.
Time Cycle Note:
A Time Cycle Trade (Sell) is suggested.
Market is projected to fall between October 18–23, 2025.
In short, the chart forecasts the completion of an Ending Diagonal near 47,200–47,500 levels, followed by a significant downside move toward the 43,000 zone starting late October 2025.
Trade fechado: objetivo atingido
Technical Analyst BY Passion
Aviso legal
As informações e publicações não se destinam a ser, e não constituem, conselhos ou recomendações financeiras, de investimento, comerciais ou de outro tipo fornecidos ou endossados pela TradingView. Leia mais nos Termos de Uso.
Technical Analyst BY Passion
Aviso legal
As informações e publicações não se destinam a ser, e não constituem, conselhos ou recomendações financeiras, de investimento, comerciais ou de outro tipo fornecidos ou endossados pela TradingView. Leia mais nos Termos de Uso.