Viés de baixa
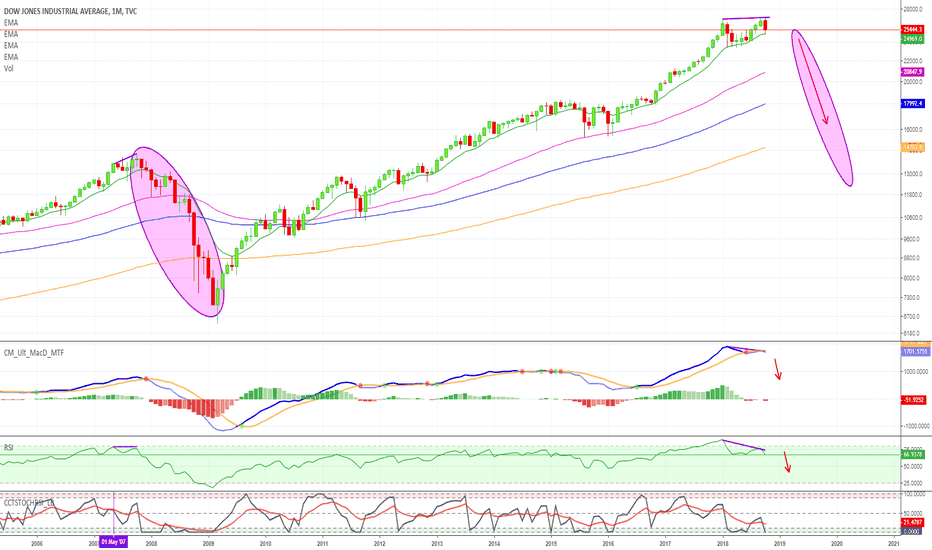
Dow Jones Industrial Average Crash Ahead (Bearish Divergence)

The chart for the Dow Jones (DJI) is basically the same one as the S&P 500 (SPX). So needless to say, this one will crash as well.
My long term analysis for DJI is still valid, you can see it here:
This new crash that is incoming is just an extension of the one I mentioned above.
Looking at the chart:
Make sure to SELL/SHORT before the crash.
P.S. This information and all information shared on the Alan Masters (@alanmasters) channel is solely for learning and entertainment purposes only. This is not financial advice.
Hit LIKE if you found this useful in any way.
Thanks a lot for reading.
This is Alan Masters.
Enjoy your weekend.
Namaste.
My long term analysis for DJI is still valid, you can see it here:

This new crash that is incoming is just an extension of the one I mentioned above.
Looking at the chart:
- We have bearish divergence showing up on the MACD and RSI.
- The rising wedge pattern is bearish in nature.
- Resistance is being reached. Expect a minor push up followed by the drop.
Make sure to SELL/SHORT before the crash.
P.S. This information and all information shared on the Alan Masters (@alanmasters) channel is solely for learning and entertainment purposes only. This is not financial advice.
Hit LIKE if you found this useful in any way.
Thanks a lot for reading.
This is Alan Masters.
Enjoy your weekend.
Namaste.
🔥 PREMIUM Trade-Numbers
lamatrades.com (Since 2017)
🏆 Results: t.me/alansantana1111/5935
🥇XRP +1950 🥇ADA +2216% 🥇AVA +536% 🥇AAVE +417%
t.me/alansantanatrades/971
🔝 Cryptocurrency Technical Analysis
followalan.com
lamatrades.com (Since 2017)
🏆 Results: t.me/alansantana1111/5935
🥇XRP +1950 🥇ADA +2216% 🥇AVA +536% 🥇AAVE +417%
t.me/alansantanatrades/971
🔝 Cryptocurrency Technical Analysis
followalan.com
Publicações relacionadas
Aviso legal
As informações e publicações não devem ser e não constituem conselhos ou recomendações financeiras, de investimento, de negociação ou de qualquer outro tipo, fornecidas ou endossadas pela TradingView. Leia mais em Termos de uso.