📝 1. Market Context
The
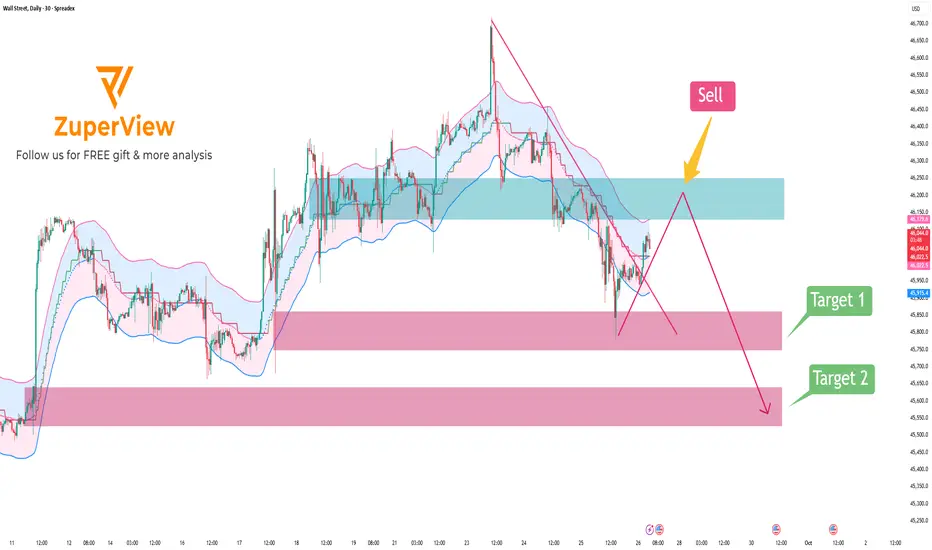
🟥 2. Resistance Zone
The major resistance is located around 46,250 – 46,130 (highlighted in blue on the chart):
• This zone overlaps with the EMA and the upper band of the Keltner Channel.
• It was previously a sideways consolidation area that has now turned into resistance.
• It also intersects with the descending trendline, making a bearish rejection likely.
🟩 3. Support Zone
The nearest support lies at 45,858 – 45,748 (first pink zone).
If price breaks below this level, it is likely to continue falling toward the lower support zone at 45,520 – 45,640 (second pink zone).
🚨 4. Bearish Scenario
• Main scenario: Wait for a price pullback into the 46,250 – 46,130 area and watch for bearish signals → then SELL.
• Target: First target at 45,860 – 45,750 → if broken, expect further decline toward 45,520 – 45,640.
• Invalidation: A daily close above 46,250 would invalidate this bearish setup.
Please like and comment to support our traders. Your feedback motivates us to produce more analysis in the future 🙏✨
👉 Explore all indicators & systems: zuperview.com/
👉 Join our Discord community: disscord.gg/YKE6ujrw59
Many free indicators will come in the future, stay updated!
👉 Join our Discord community: disscord.gg/YKE6ujrw59
Many free indicators will come in the future, stay updated!
Aviso legal
As informações e publicações não devem ser e não constituem conselhos ou recomendações financeiras, de investimento, de negociação ou de qualquer outro tipo, fornecidas ou endossadas pela TradingView. Leia mais em Termos de uso.