### 📊 **Chart Analysis: Potential W or Flag Breakout**
#### **1. Pattern Structure**
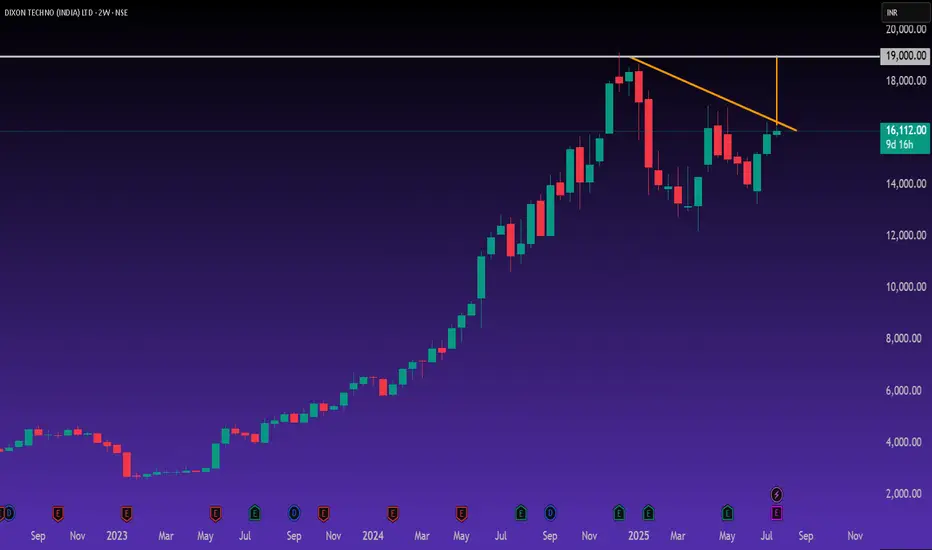
* The chart seems to be forming a **W-shaped base (Double Bottom)** or a **falling wedge / flag breakout**.
* The stock had made two significant lows, and now it's **attempting a breakout above the neckline/resistance** around the ₹16,000–₹16,200 zone.
* The **orange trendline** marks the falling resistance, which has now been **challenged**.
#### **2. Bullish Momentum**
* A **bullish engulfing candle** recently formed, indicating buyer strength.
* If the breakout sustains above the falling trendline and ₹16,500 zone, a **measured move towards ₹19,000+** looks very likely.
#### **3. Target Projection**
* Based on the **height of the pattern**, the vertical distance from the bottom to the neckline gives a **potential breakout target of ₹19,000**, which is also marked on the chart.
#### **4. Confirmation Levels**
* **Breakout level:** ₹16,200–₹16,500
* **Target:** ₹19,000+
* **Stop-loss (for traders):** Below ₹15,000 (previous swing low)
---
### ⚠️ Disclaimer
This is a technical analysis observation, not a trading recommendation. Please consult with a SEBI-registered advisor before making any investment decisions.
#### **1. Pattern Structure**
* The chart seems to be forming a **W-shaped base (Double Bottom)** or a **falling wedge / flag breakout**.
* The stock had made two significant lows, and now it's **attempting a breakout above the neckline/resistance** around the ₹16,000–₹16,200 zone.
* The **orange trendline** marks the falling resistance, which has now been **challenged**.
#### **2. Bullish Momentum**
* A **bullish engulfing candle** recently formed, indicating buyer strength.
* If the breakout sustains above the falling trendline and ₹16,500 zone, a **measured move towards ₹19,000+** looks very likely.
#### **3. Target Projection**
* Based on the **height of the pattern**, the vertical distance from the bottom to the neckline gives a **potential breakout target of ₹19,000**, which is also marked on the chart.
#### **4. Confirmation Levels**
* **Breakout level:** ₹16,200–₹16,500
* **Target:** ₹19,000+
* **Stop-loss (for traders):** Below ₹15,000 (previous swing low)
---
### ⚠️ Disclaimer
This is a technical analysis observation, not a trading recommendation. Please consult with a SEBI-registered advisor before making any investment decisions.
Aviso legal
As informações e publicações não devem ser e não constituem conselhos ou recomendações financeiras, de investimento, de negociação ou de qualquer outro tipo, fornecidas ou endossadas pela TradingView. Leia mais em Termos de uso.
Aviso legal
As informações e publicações não devem ser e não constituem conselhos ou recomendações financeiras, de investimento, de negociação ou de qualquer outro tipo, fornecidas ou endossadas pela TradingView. Leia mais em Termos de uso.