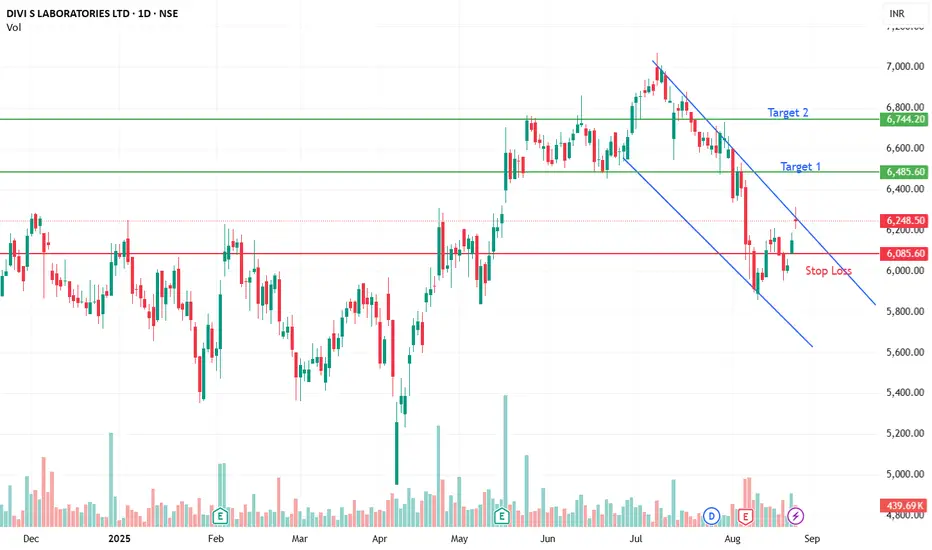
Entry @6248
✅ Overall View
Current Price: ₹6248.50
RSI (Relative Strength Index): 47.62 → This indicates a neutral zone (neither overbought nor oversold).
✅ Support and Resistance Levels
Supports:
S1: ₹6010
S2: ₹6020.35
S3: ₹6162
Price is above all supports, which is positive.
Resistances:
R1: ₹6248.90 (current price is very close)
R2: ₹6275.85
R3: ₹6282.50
The stock is near its immediate resistance, so watch for a breakout above ₹6249–₹6282.
✅ Fibonacci Levels
Key levels derived from previous swing:
23.6%: ₹3754.59
38.2%: ₹4388.45
50%: ₹4900.75
61.8%: ₹5413.05
78.6%: ₹6142.42 (Price is above this level → bullish sign)
✅ Moving Averages
Short-Term:
EMA5 = ₹6141.71, SMA5 = ₹6102.50 → Price is above both → short-term trend is positive.
EMA9 = ₹6136.91, SMA9 = ₹6096.78 → Also bullish short-term.
Medium-Term:
EMA20 = ₹6237.30, SMA20 = ₹6240.43 → Price is slightly above → neutral to bullish.
Long-Term:
EMA50 = ₹6383.40, SMA50 = ₹6532.76 → Price is below → long-term still weak.
EMA200 = ₹6038.53, SMA200 = ₹6107.82 → Price is above → long-term trend is positive.
✅ Interpretation
RSI near 47 → Neutral (not overbought or oversold).
Price near immediate resistance (6248.90) → If breaks above ₹6282 with volume, bullish momentum possible.
Above major Fibonacci (78.6%) and above 200-day EMA/SMA → Long-term bullish bias.
Medium-term and short-term averages show slight strength but need a breakout above ₹6282 for strong uptrend.
Aviso legal
As informações e publicações não se destinam a ser, e não constituem, conselhos ou recomendações financeiras, de investimento, comerciais ou de outro tipo fornecidos ou endossados pela TradingView. Leia mais nos Termos de Uso.
Aviso legal
As informações e publicações não se destinam a ser, e não constituem, conselhos ou recomendações financeiras, de investimento, comerciais ou de outro tipo fornecidos ou endossados pela TradingView. Leia mais nos Termos de Uso.