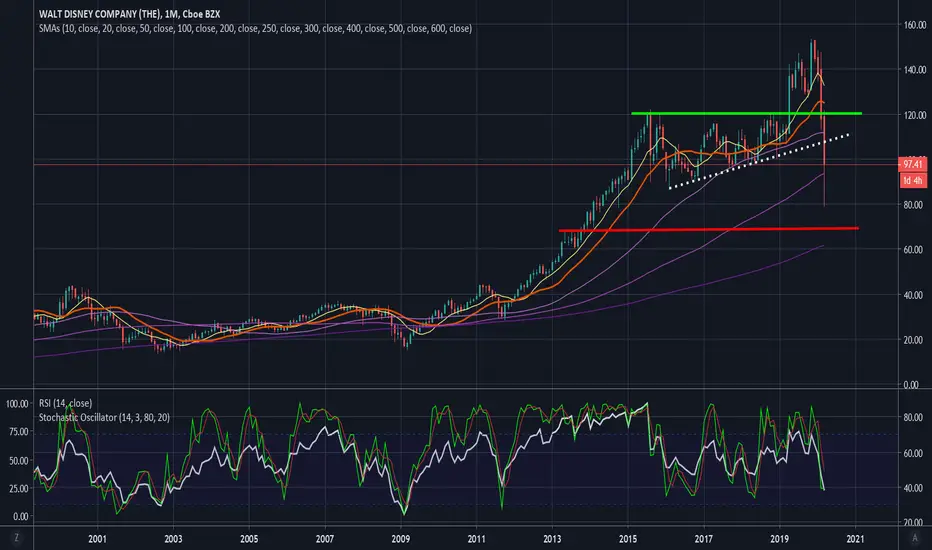
The white dotted line is from a previous chart. Stock may move up to that resistance line. It may also move up to 120 (green line) or down to 70 (red line). I am looking at daily RSI, along with other signals, to decide on puts or calls.
Trade ativo
bought weekly 103 calls at 2.64. looking for 105 target and higherTrade fechado manualmente
Out at 2.45. I see 30min resistance near 103, and RSI might stall around 60. daily RSI still below 50. stock may move up later but I lost confidence in trade after I took a better look at chart. ITrade ativo
Opening puts. I suggest weekly 100 puts, or 4/17 95 strike.Aviso legal
As informações e publicações não devem ser e não constituem conselhos ou recomendações financeiras, de investimento, de negociação ou de qualquer outro tipo, fornecidas ou endossadas pela TradingView. Leia mais em Termos de uso.
Aviso legal
As informações e publicações não devem ser e não constituem conselhos ou recomendações financeiras, de investimento, de negociação ou de qualquer outro tipo, fornecidas ou endossadas pela TradingView. Leia mais em Termos de uso.