✅ Key current context
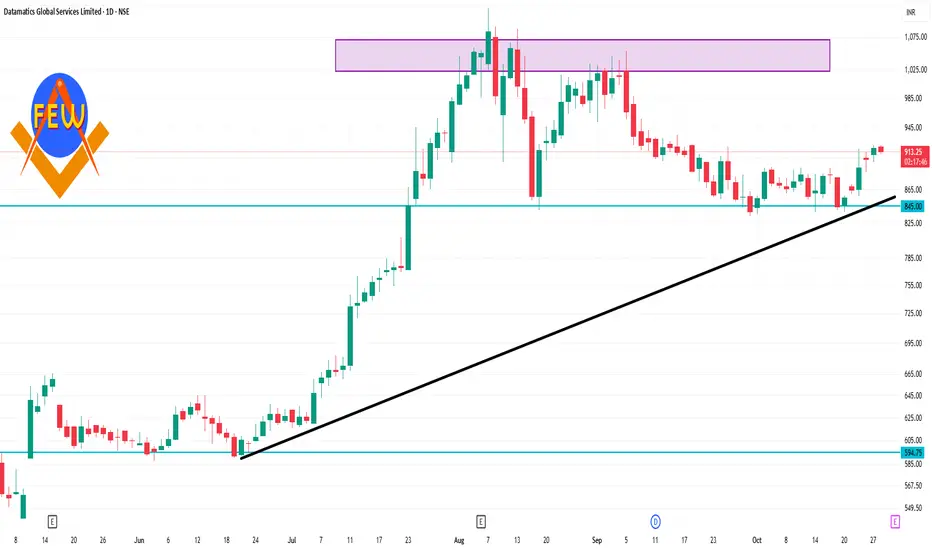
The stock is trading around ₹900-₹915 (last close ~₹903.60).
The 52-week high is ~ ₹1,120, low ~ ₹515.
Short-term momentum indicators show bullish bias: e.g., moving averages across 5, 10, 20, 50, 100, 200 days are all signalling “buy”.
Technical services list daily pivot/support/resistance levels for the stock.
Publicações relacionadas
Aviso legal
As informações e publicações não se destinam a ser, e não constituem, conselhos ou recomendações financeiras, de investimento, comerciais ou de outro tipo fornecidos ou endossados pela TradingView. Leia mais nos Termos de Uso.
Publicações relacionadas
Aviso legal
As informações e publicações não se destinam a ser, e não constituem, conselhos ou recomendações financeiras, de investimento, comerciais ou de outro tipo fornecidos ou endossados pela TradingView. Leia mais nos Termos de Uso.