COMP/USDT is currently at a critical crossroads.
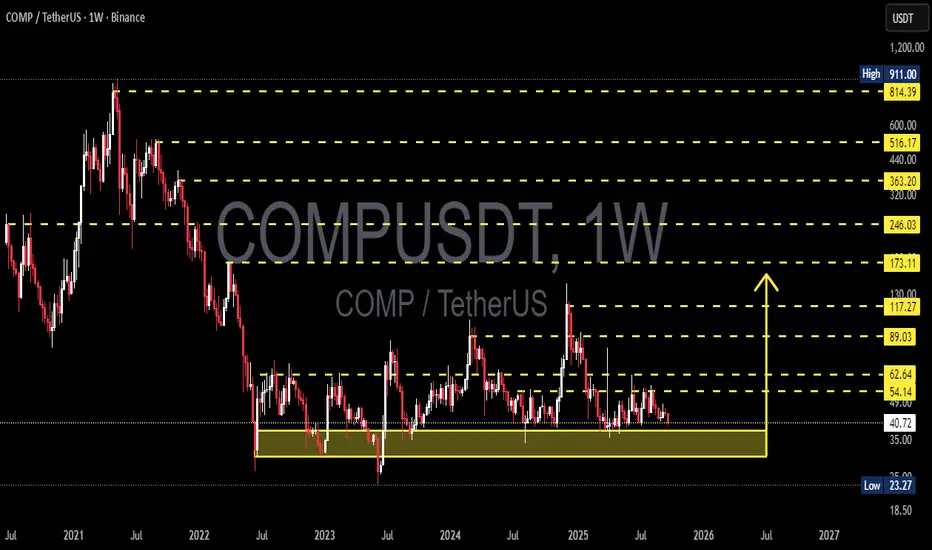
For months, price has been consolidating inside the long-term accumulation range between 23.27 – 40.88 (yellow box). This area has acted as a historical demand zone since 2022, and multiple retests have reinforced its importance.
Such prolonged sideways movement often signals an accumulation phase, where the market builds up energy before a significant breakout or breakdown. The direction of this move could define COMP’s trend for the coming months or even years.
---
🔹 Structure & Market Dynamics
Main trend: COMP has been in a macro downtrend since its 2021 peak, but now forming a potential accumulation base.
Strong range: 23.27 – 40.88 is a multi-tested support box that holds the key to the next move.
Key resistance: 54.14 – 62.64 is the crucial breakout zone. A close above this will shift mid-term momentum to the bulls.
Potential move: Long consolidations like this usually lead to explosive breakouts once the range is broken.
---
🔺 Bullish Scenario
1. Trigger: Weekly close above 62.64 with strong volume → signals bulls regaining control.
2. Targets:
Measured move projection: ~58.5 (first step).
If momentum follows: 89.03 → 117.27 → 173.11.
3. Reversal confirmation: Formation of higher highs & higher lows on the weekly timeframe could mark the start of a new bullish cycle.
---
🔻 Bearish Scenario
1. Trigger: Weekly close below 23.27 → confirms demand exhaustion.
2. Impact: Breakdown from this long-term support may trigger a capitulation sell-off, driving prices much lower.
3. Confirmation: Repeated rejection from resistance + rising sell volume would validate continuation of the bearish trend.
---
🎯 Key Takeaways
The longer the consolidation, the bigger the potential breakout.
23.27 (support) and 62.64 (resistance) are the two most important levels to watch.
Traders can use this area for measured accumulation with tight risk controls, or simply wait for confirmation of breakout/breakdown before positioning with the trend.
---
📌 Conclusion
COMP is at a critical inflection point. A breakout above 62.64 could open the door for a multi-layered bullish rally toward 173+. On the flip side, a breakdown below 23.27 would likely extend the bearish cycle and push COMP into new lows.
This 23–40 zone is where the ultimate battle between buyers and sellers is taking place — and the outcome will decide COMP’s long-term trajectory.
---
#COMP #COMPUSDT #Compound #Crypto #Altcoins #DeFi #TechnicalAnalysis #PriceAction #WeeklyChart #CryptoTrading
✅ Get Free Signals! Join Our Telegram Channel Here: t.me/TheCryptoNuclear
✅ Twitter: twitter.com/crypto_nuclear
✅ Join Bybit : partner.bybit.com/b/nuclearvip
✅ Benefits : Lifetime Trading Fee Discount -50%
✅ Twitter: twitter.com/crypto_nuclear
✅ Join Bybit : partner.bybit.com/b/nuclearvip
✅ Benefits : Lifetime Trading Fee Discount -50%
Aviso legal
The information and publications are not meant to be, and do not constitute, financial, investment, trading, or other types of advice or recommendations supplied or endorsed by TradingView. Read more in the Terms of Use.