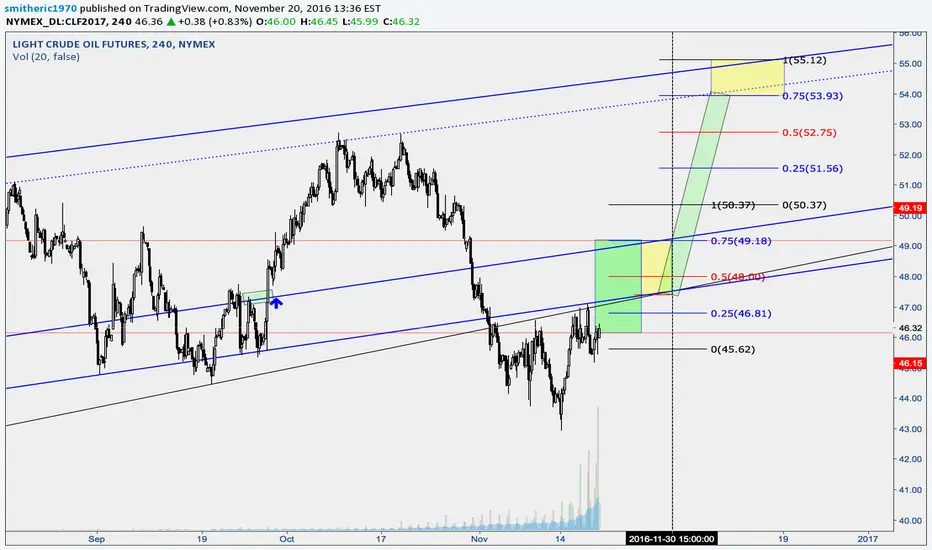
Support chart for my Oil Long into OPEC - Clones chart showing previous channel and price legs.
Blue are channel repeat legs; Red are S/R price based legs showing a potential jump this week and lower black is a pivot. I've included the same daily TR clones as the related chart that includes trading details and if this plays out I'll expect that mid term prices will find 51.75 - 53.93 support.
Good trading all!
Publicações relacionadas
Aviso legal
As informações e publicações não devem ser e não constituem conselhos ou recomendações financeiras, de investimento, de negociação ou de qualquer outro tipo, fornecidas ou endossadas pela TradingView. Leia mais em Termos de uso.
Publicações relacionadas
Aviso legal
As informações e publicações não devem ser e não constituem conselhos ou recomendações financeiras, de investimento, de negociação ou de qualquer outro tipo, fornecidas ou endossadas pela TradingView. Leia mais em Termos de uso.