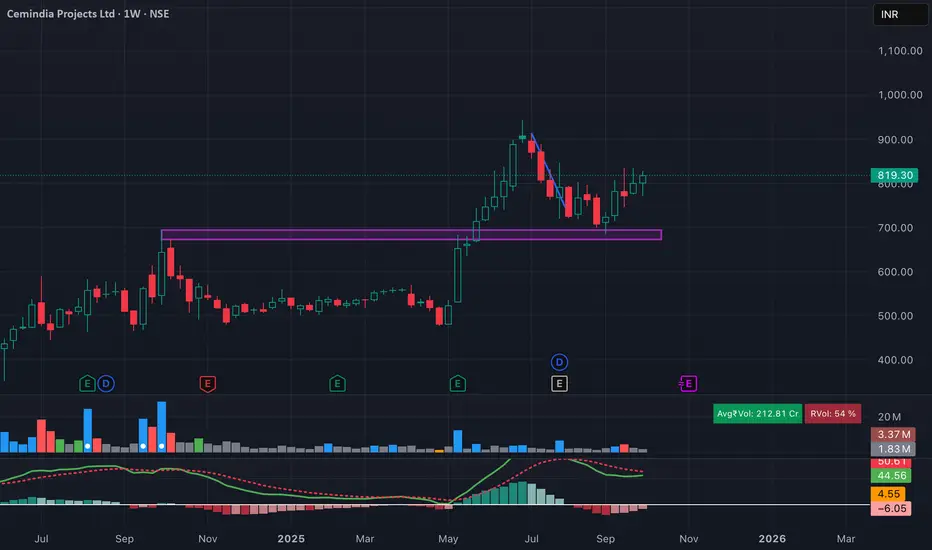
Cemindia Projects has successfully retested its breakout zone around 700–720 and is showing strength on the weekly chart. The stock has formed a higher low and is now turning up with fresh momentum. MACD is flattening out, suggesting trend reversal possibility.
📌 Swing Trade Idea
Entry Zone: Current levels (around 815–820)
Stop Loss (SL): 765 (Weekly closing basis)
View: As long as price holds above 765, bias remains bullish with potential for higher levels in the coming weeks.
📌 Swing Trade Idea
Entry Zone: Current levels (around 815–820)
Stop Loss (SL): 765 (Weekly closing basis)
View: As long as price holds above 765, bias remains bullish with potential for higher levels in the coming weeks.
Aviso legal
As informações e publicações não devem ser e não constituem conselhos ou recomendações financeiras, de investimento, de negociação ou de qualquer outro tipo, fornecidas ou endossadas pela TradingView. Leia mais em Termos de uso.
Aviso legal
As informações e publicações não devem ser e não constituem conselhos ou recomendações financeiras, de investimento, de negociação ou de qualquer outro tipo, fornecidas ou endossadas pela TradingView. Leia mais em Termos de uso.