CELG forms 3 weeks tight
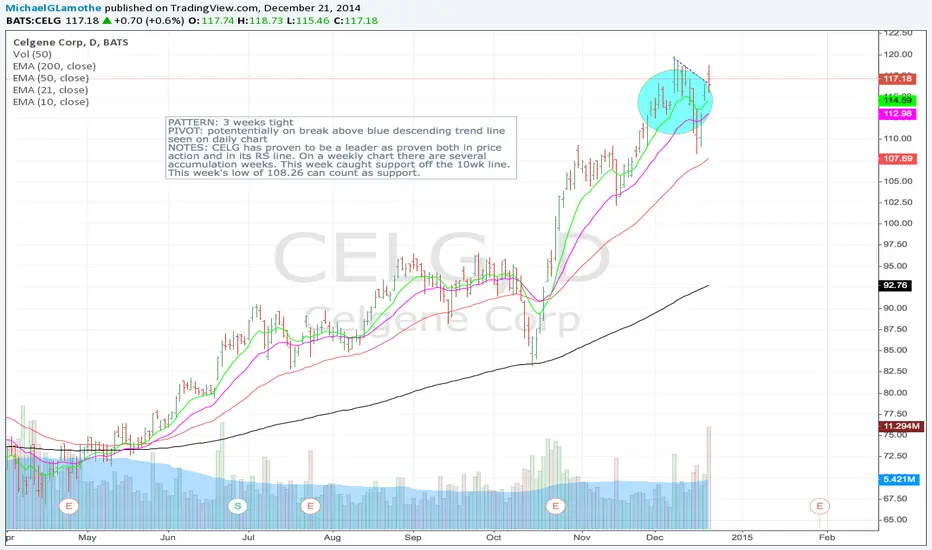
PATTERN: 3 weeks tight
PIVOT: potententially on break above blue descending trend line seen on daily chart
NOTES: CELG has proven to be a leader as proven both in price action and in its RS line. On a weekly chart there are several accumulation weeks. This week caught support off the 10wk line. This week's low of 108.26 can count as support.
Aviso legal
As informações e publicações não devem ser e não constituem conselhos ou recomendações financeiras, de investimento, de negociação ou de qualquer outro tipo, fornecidas ou endossadas pela TradingView. Leia mais em Termos de uso.
Aviso legal
As informações e publicações não devem ser e não constituem conselhos ou recomendações financeiras, de investimento, de negociação ou de qualquer outro tipo, fornecidas ou endossadas pela TradingView. Leia mais em Termos de uso.