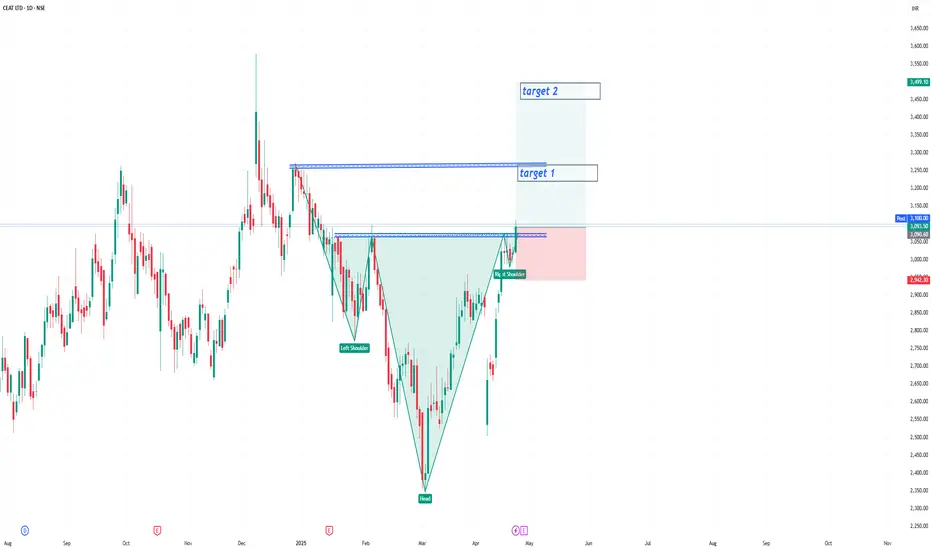
CEAT Ltd has formed a classic Cup & Handle pattern on the daily chart, indicating a strong bullish continuation setup.
Breakout supported by increasing volume
Retest zone: 3,000 – 3,050 (Good entry opportunity)
SL: 2,870 (below handle support)
📈 Targets:
T1: 3,300
T2: 3,500
T3: 3,900 (measured move target)
💡 Bias: Bullish continuation | Swing to Positional
🕒 Timeframe: Daily Chart
Breakout supported by increasing volume
Retest zone: 3,000 – 3,050 (Good entry opportunity)
SL: 2,870 (below handle support)
📈 Targets:
T1: 3,300
T2: 3,500
T3: 3,900 (measured move target)
💡 Bias: Bullish continuation | Swing to Positional
🕒 Timeframe: Daily Chart
Aviso legal
As informações e publicações não devem ser e não constituem conselhos ou recomendações financeiras, de investimento, de negociação ou de qualquer outro tipo, fornecidas ou endossadas pela TradingView. Leia mais em Termos de uso.
Aviso legal
As informações e publicações não devem ser e não constituem conselhos ou recomendações financeiras, de investimento, de negociação ou de qualquer outro tipo, fornecidas ou endossadas pela TradingView. Leia mais em Termos de uso.