🧠 Concept Overview
The Candle Range Detector (CRD) visualizes how market volatility expands and contracts across time.
Instead of using a static multiplier, it applies Fibonacci ratios (0.618, 1.0, 1.618, 2.618, etc.) to dynamically scale candle ranges, helping traders spot where price might react or exhaust.
Each detected candle range forms a zone or band representing potential continuation or reversal interest areas.
This adaptive approach captures market rhythm more naturally than uniform multipliers.
⸻
⚙️ How It Works
1. Range Detection:
The indicator measures the true range (high–low) of key candles and maps them forward on the chart.
2. Fibonacci Expansion Logic:
Instead of a normal “x times range” multiplier, Fibonacci levels are used to project natural extensions and contractions from each candle’s body or wick.
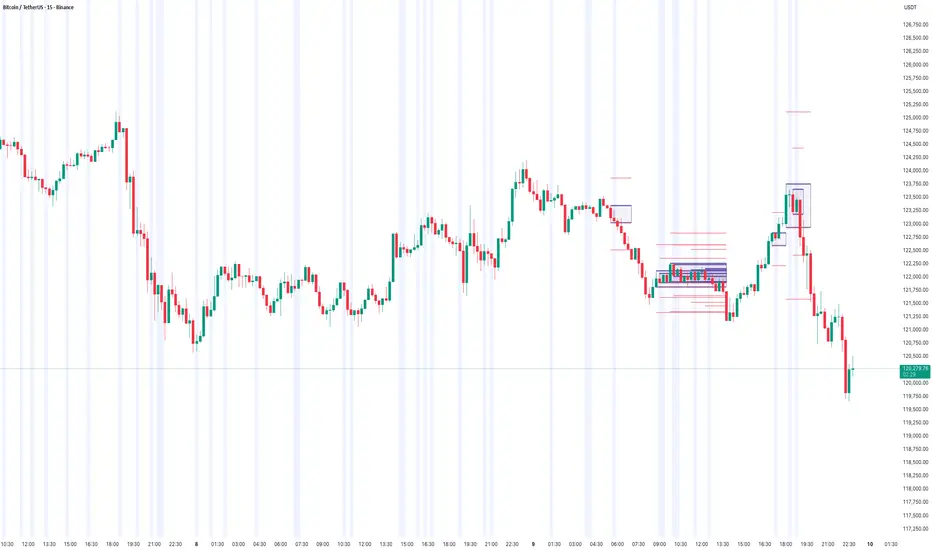
3. Zone Formation:
Each candle’s range forms a rectangular area (as shown on your chart).
• Thicker Boxes: Represent strong impulsive candles or high-volume bars.
• Lighter Boxes: Represent pullback or resting candles.
4. Automatic Overlap Handling:
When two zones overlap, the indicator visually merges them, highlighting confluence where multiple candle ranges align — a sign of strong market memory.
⸻
📊 How to Interpret
• When price revisits a previously detected Fibonacci expansion zone, it often reacts (pause or reversal).
• A cluster of zones at similar levels acts like a dynamic supply/demand region.
• Breakouts beyond upper/lower Fibonacci bands may indicate trend continuation.
• Tight clusters of small ranges suggest compression – potential breakout setup.
⸻
💡 Practical Use-Cases
• Identify where short-term volatility clusters before big moves.
• Spot pullback re-entries aligned with prior expansion zones.
• Detect imbalance areas that later act as resistance/support.
• Enhance confluence with volume, VWAP, or order flow indicators.
⸻
🧩 Customization Tips
• Fib Ratios: You can select or deselect Fibonacci levels from the settings panel. Right now its set to 1.618
• Zone Opacity: Adjust transparency to visualize overlaps better.
• Lookback Range: Control how many historical ranges are plotted for context.
⸻
🏁 Summary
The Candle Range Detector (Fibonacci Mode) transforms traditional range analysis into a visual map of volatility zones.
By using Fibonacci expansion instead of arbitrary multipliers, it synchronizes with natural market rhythm and highlights where liquidity and volatility converge.
The Candle Range Detector (CRD) visualizes how market volatility expands and contracts across time.
Instead of using a static multiplier, it applies Fibonacci ratios (0.618, 1.0, 1.618, 2.618, etc.) to dynamically scale candle ranges, helping traders spot where price might react or exhaust.
Each detected candle range forms a zone or band representing potential continuation or reversal interest areas.
This adaptive approach captures market rhythm more naturally than uniform multipliers.
⸻
⚙️ How It Works
1. Range Detection:
The indicator measures the true range (high–low) of key candles and maps them forward on the chart.
2. Fibonacci Expansion Logic:
Instead of a normal “x times range” multiplier, Fibonacci levels are used to project natural extensions and contractions from each candle’s body or wick.
3. Zone Formation:
Each candle’s range forms a rectangular area (as shown on your chart).
• Thicker Boxes: Represent strong impulsive candles or high-volume bars.
• Lighter Boxes: Represent pullback or resting candles.
4. Automatic Overlap Handling:
When two zones overlap, the indicator visually merges them, highlighting confluence where multiple candle ranges align — a sign of strong market memory.
⸻
📊 How to Interpret
• When price revisits a previously detected Fibonacci expansion zone, it often reacts (pause or reversal).
• A cluster of zones at similar levels acts like a dynamic supply/demand region.
• Breakouts beyond upper/lower Fibonacci bands may indicate trend continuation.
• Tight clusters of small ranges suggest compression – potential breakout setup.
⸻
💡 Practical Use-Cases
• Identify where short-term volatility clusters before big moves.
• Spot pullback re-entries aligned with prior expansion zones.
• Detect imbalance areas that later act as resistance/support.
• Enhance confluence with volume, VWAP, or order flow indicators.
⸻
🧩 Customization Tips
• Fib Ratios: You can select or deselect Fibonacci levels from the settings panel. Right now its set to 1.618
• Zone Opacity: Adjust transparency to visualize overlaps better.
• Lookback Range: Control how many historical ranges are plotted for context.
⸻
🏁 Summary
The Candle Range Detector (Fibonacci Mode) transforms traditional range analysis into a visual map of volatility zones.
By using Fibonacci expansion instead of arbitrary multipliers, it synchronizes with natural market rhythm and highlights where liquidity and volatility converge.
Thanks.
TradeTech Analysis
Telegram Channel - t.me/Tradetech2024
Youtube Channel - youtube.com/@TradeTechAnalysis
Website - tradetechanalysis.com/
Super Profile - superprofile.bio/tradetechanalysis
TradeTech Analysis
Telegram Channel - t.me/Tradetech2024
Youtube Channel - youtube.com/@TradeTechAnalysis
Website - tradetechanalysis.com/
Super Profile - superprofile.bio/tradetechanalysis
Aviso legal
As informações e publicações não devem ser e não constituem conselhos ou recomendações financeiras, de investimento, de negociação ou de qualquer outro tipo, fornecidas ou endossadas pela TradingView. Leia mais em Termos de uso.