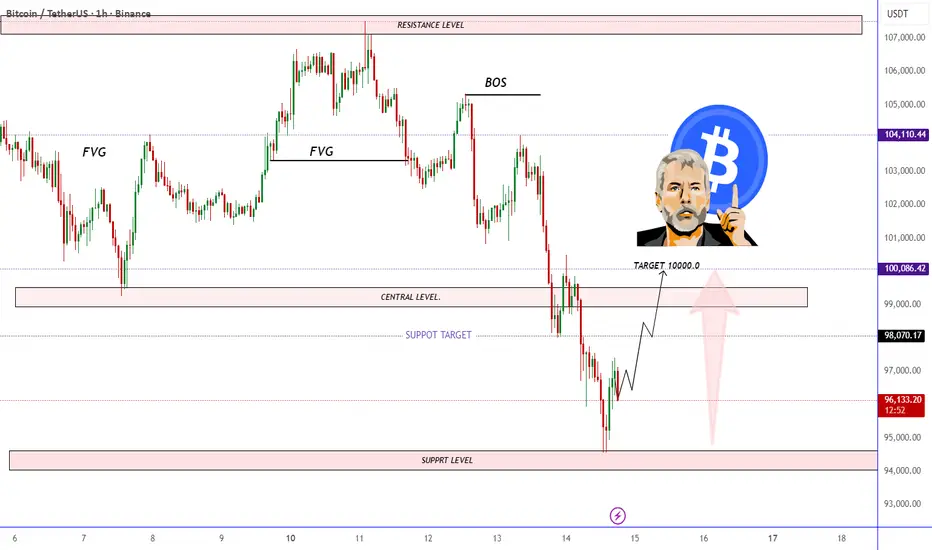
A Bitcoin price chart highlighting key ICT concepts including FVGs, BOS, support and resistance levels. The analysis suggests a potential bullish retracement from the support zone toward the central level, targeting the 100,000 USDT region. The layout shows expected price movement with marked liquidity zones and structural shifts.
Trade ativo
Trade fechado: stop atingido
🎯XAUUSD GOLD BTCUSD Daily 4_5 Free Signals 🚀📊 join Telegram channel
t.me/Gold_blue_pipshunter
✨ Join My WhatsApp Premium Group! ✨ chat.whatsapp.com/EXNJ7pGViJbEKUCDbmTOwG
Join My WhatsApp Premium Group! ✨
t.me/Gold_blue_pipshunter
✨ Join My WhatsApp Premium Group! ✨ chat.whatsapp.com/EXNJ7pGViJbEKUCDbmTOwG
Join My WhatsApp Premium Group! ✨
Aviso legal
The information and publications are not meant to be, and do not constitute, financial, investment, trading, or other types of advice or recommendations supplied or endorsed by TradingView. Read more in the Terms of Use.