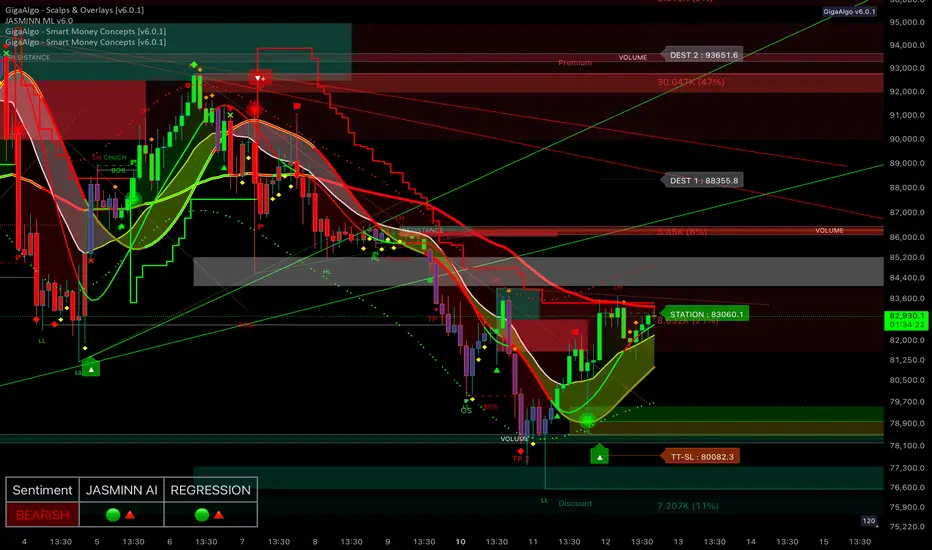
Bitcoin is showing signs of recovery on the 2-hour chart after forming a local bottom at a key support zone. The price has bounced from a strong demand area, supported by increased buyer activity, and is currently attempting to push higher within a rising channel. The formation of higher lows (HL) and higher highs (HH) suggests that bullish momentum is building in the short term.
Despite this upward movement, the overall trend remains bearish, indicated by the dominance of red moving averages and the presence of strong resistance overhead. A major resistance zone sits above the current price level, marked by significant volume and selling pressure. The sentiment remains bearish, as confirmed by the red signal on the sentiment panel, although JASMINN AI and regression tools are showing early signs of potential upward strength.
If the price manages to break above the resistance zone and hold, the next upside target lies near the destination levels identified on the chart. However, failure to maintain upward momentum could result in a pullback toward the previous support zone, where buyers are likely to step in again. The key to further upside will be a decisive break and close above the resistance, supported by rising volume and bullish momentum. The overall market outlook remains cautiously bullish in the short term but within a larger bearish trend.
Aviso legal
As informações e publicações não devem ser e não constituem conselhos ou recomendações financeiras, de investimento, de negociação ou de qualquer outro tipo, fornecidas ou endossadas pela TradingView. Leia mais em Termos de uso.
Aviso legal
As informações e publicações não devem ser e não constituem conselhos ou recomendações financeiras, de investimento, de negociação ou de qualquer outro tipo, fornecidas ou endossadas pela TradingView. Leia mais em Termos de uso.