Bitcoin may be approaching a significant macro top, with multiple technical indicators aligning to signal a potential reversal and a subsequent major corrective wave.
Key Projections:
Key Projections:
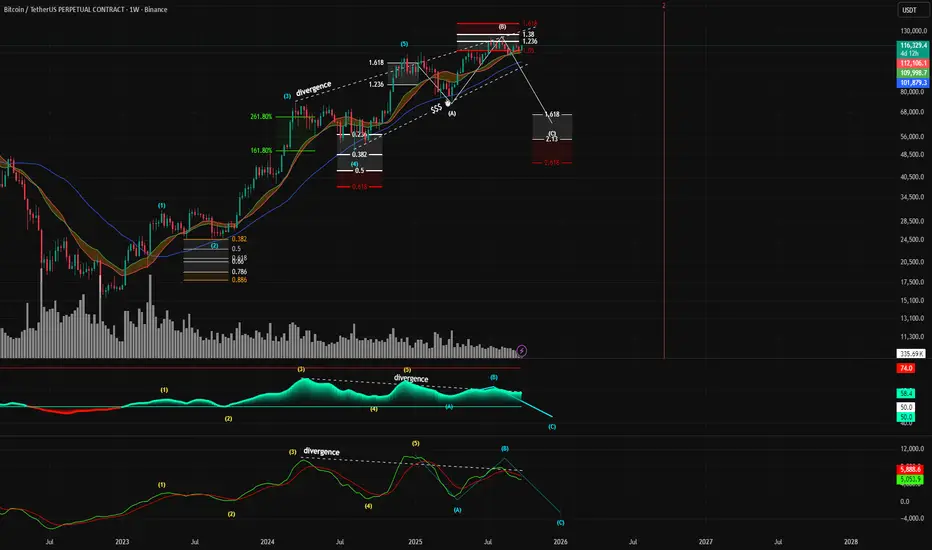
- Potential Top Formation: The current price action is forming what appears to be the peak of a corrective Wave (B), with a potential top range between $109,000 and $150,000.
- Projected Corrective Target: Following the completion of Wave (B), a significant downward move, labeled as Wave (C), is anticipated. This corrective wave targets the $45,000 - $67,000 price zone.
- Timeline: The entire corrective structure, from the formation of the top to the potential bottom of Wave (C), is projected to unfold by approximately September 2026.
- Elliott Wave Structure: The primary thesis is based on an Elliott Wave count. The chart indicates the completion of a five-wave impulse cycle, and the market is now in a larger A-B-C corrective pattern. The current price is likely forming the peak of the B-wave.
- Fibonacci Confluence: There is a strong confluence of Fibonacci extension levels at the potential top. The peak of the current Wave (B) is precisely testing the 1.618 Fibonacci extension level, a critical ratio often associated with the termination of corrective waves.
- Significant Bearish Divergence (Crucial Point): This is one of the most compelling signals on the chart.While the price is making higher highs (from the peak of wave (5) to the peak of wave (B)).Both the RSI and the MACD indicators are showing lower highs. This is a classic, multi-indicator bearish divergence on a high timeframe (weekly), indicating that the upward momentum is weakening significantly and a trend reversal is becoming more likely.
Aviso legal
As informações e publicações não devem ser e não constituem conselhos ou recomendações financeiras, de investimento, de negociação ou de qualquer outro tipo, fornecidas ou endossadas pela TradingView. Leia mais em Termos de uso.
Aviso legal
As informações e publicações não devem ser e não constituem conselhos ou recomendações financeiras, de investimento, de negociação ou de qualquer outro tipo, fornecidas ou endossadas pela TradingView. Leia mais em Termos de uso.