Bitcoin 15-Minute Chart Analysis
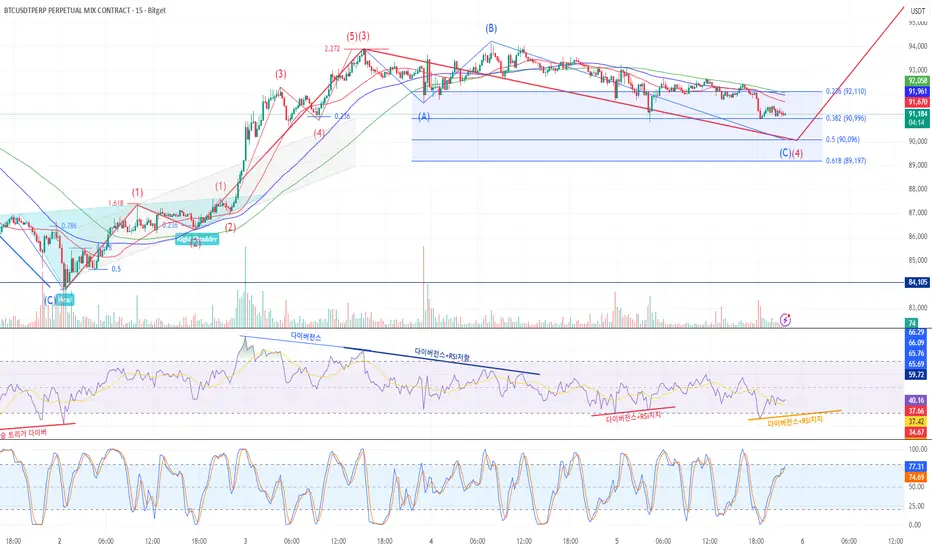
The larger Wave ③ initiated after a breakout above an inverse head and shoulders pattern.
Wave ③ appears to have completed near the 2.272 Fibonacci extension, followed by a divergence, signaling the start of a correction.
A mild A–B corrective rebound occurred, then another drop followed after a second divergence and RSI resistance.
Currently, moving averages remain in a bearish alignment (death cross).
Refer to Fibonacci retracement levels to gauge the depth of Wave ④.
Wave ④ completion will depend on the presence of divergence and RSI support signals.
'규칙' & '패턴' 그리고 '조합'
blog.naver.com/lightvblue
blog.naver.com/lightvblue
Aviso legal
As informações e publicações não se destinam a ser, e não constituem, conselhos ou recomendações financeiras, de investimento, comerciais ou de outro tipo fornecidos ou endossados pela TradingView. Leia mais nos Termos de Uso.