and call it good i guess
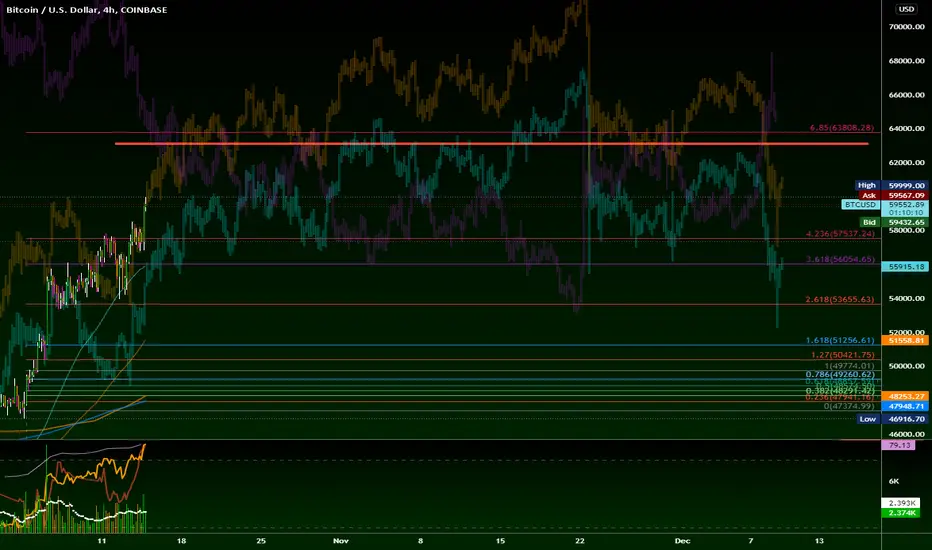
Bitcoin /USD rate (October 2021-2022)
Maybe we remain bullish until $63k-$64k? idk do not ask me ;) This is just speculative and not guaranteed, but still a confident belief with how the weekly volume data is trending downwards while price pumps up. I can still can be 100% wrong, no doubt in my mind.
The purple path I've marked is kind of an "alternated divergence" path along a couple points I would suspect would turn around from the orange path the most. There's probably too much in the real patterns that will print over the next 2 months going on to really tell but idk its kind of like astrology for bitcoin. Orange path is where I think we have alternated off of blue path for price and time frame.


Thanks for tuning in :) Disclaimer, anyone in the trade needs to do their own due diligence and decide what is right for YOU. My charts can be wrong at any time and it's very important that you have your own strategies and plans in place. I run this channel for my own educational purposes of learning to trade, and I will never be 100% right, so please do not let me confirm any bias for you! (Dangerous to do so, stay safe and remember the basics & rules of risk assessment.) Expect the unexpected and happy trading
Bitcoin /USD rate (October 2021-2022)
Maybe we remain bullish until $63k-$64k? idk do not ask me ;) This is just speculative and not guaranteed, but still a confident belief with how the weekly volume data is trending downwards while price pumps up. I can still can be 100% wrong, no doubt in my mind.
The purple path I've marked is kind of an "alternated divergence" path along a couple points I would suspect would turn around from the orange path the most. There's probably too much in the real patterns that will print over the next 2 months going on to really tell but idk its kind of like astrology for bitcoin. Orange path is where I think we have alternated off of blue path for price and time frame.
Thanks for tuning in :) Disclaimer, anyone in the trade needs to do their own due diligence and decide what is right for YOU. My charts can be wrong at any time and it's very important that you have your own strategies and plans in place. I run this channel for my own educational purposes of learning to trade, and I will never be 100% right, so please do not let me confirm any bias for you! (Dangerous to do so, stay safe and remember the basics & rules of risk assessment.) Expect the unexpected and happy trading
Publicações relacionadas
Aviso legal
As informações e publicações não devem ser e não constituem conselhos ou recomendações financeiras, de investimento, de negociação ou de qualquer outro tipo, fornecidas ou endossadas pela TradingView. Leia mais em Termos de uso.
Publicações relacionadas
Aviso legal
As informações e publicações não devem ser e não constituem conselhos ou recomendações financeiras, de investimento, de negociação ou de qualquer outro tipo, fornecidas ou endossadas pela TradingView. Leia mais em Termos de uso.