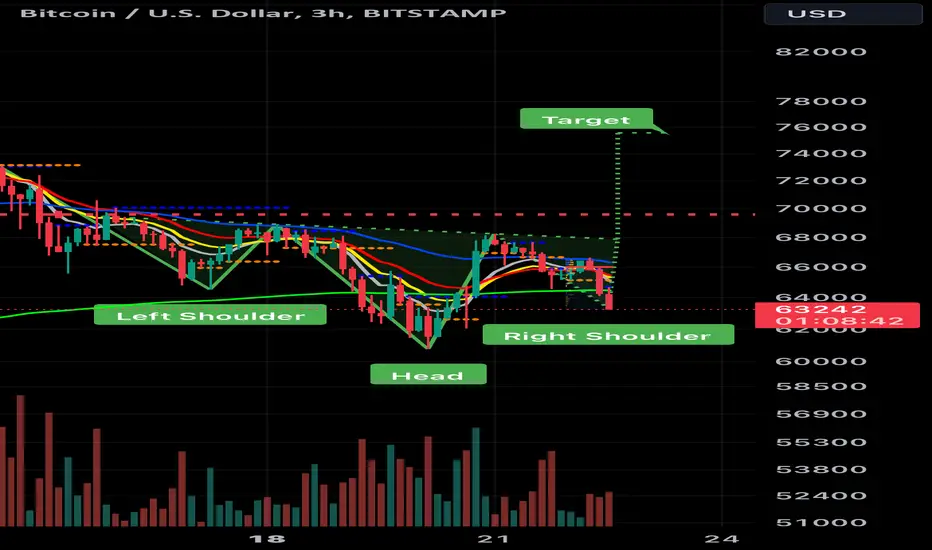
The BTC/USD 3-hour chart suggests a potential inverted head and shoulders pattern, indicating a possible bullish reversal.
Conversely, the daily chart hints at a head and shoulders pattern, suggesting a potential bearish trend. This contradiction creates uncertainty.
The presence of both an inverted head and shoulders (bullish) on the 3-hour chart and a head and shoulders (bearish) on the daily chart creates ambiguity. This is a classic example of a confluence issue in technical analysis.
The inverted head and shoulders could be a fakeout, a deceptive pattern that lures investors into buying before reversing course.
The market might be consolidating before a more definitive breakout in either direction.
Trade ativo
Nota
As long as btc can hold the 200 ema it looks probable.Trade ativo
Nota
Nota
Not a bad R:R. 69k is strong resistance but if anything can break it bitcoin can.Nota
Nota
Lots of resistance on the way. I’m better off with no stops these days.Nota
Nota
Nota
Nice set up overall.Nota
Nota
Pennant formed within the larger trend.Trade ativo
Nota
Nota
Here is the original set up.Nota
Nota
Classic fake out to shake out the over leveraged tradersTrade ativo
Nota
How many people shorted this? Raise your hand.Nota
Nota
Sideways for now.Trade ativo
Nota
Let’s see how this small pennant reacts to a break out.Nota
Trade ativo
Still on track for new ATH. Never in a straight line.Nota
Trade ativo
Nota
Nota
Never lose sight never use too much leverageNota
USDT: 0xd3787d843Cf915E5475119459B34b6429827c297
Aviso legal
As informações e publicações não devem ser e não constituem conselhos ou recomendações financeiras, de investimento, de negociação ou de qualquer outro tipo, fornecidas ou endossadas pela TradingView. Leia mais em Termos de uso.
USDT: 0xd3787d843Cf915E5475119459B34b6429827c297
Aviso legal
As informações e publicações não devem ser e não constituem conselhos ou recomendações financeiras, de investimento, de negociação ou de qualquer outro tipo, fornecidas ou endossadas pela TradingView. Leia mais em Termos de uso.