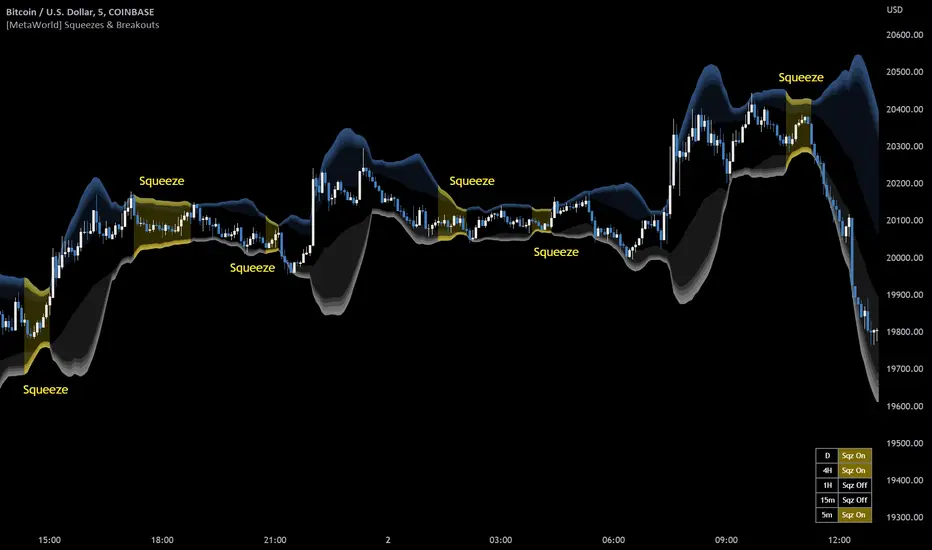
Squeezes Visualization
Volatility Bands [\b]
Squeeze Table [\b]
- Squeezes occur when an asset's price volatility falls to statistically low levels.
- Breakouts from the squeeze are typically violent and potentially highly profitable if the trader can get in the trade early and catch the breakout in the right direction.
- MetaWorld Squeezes & Breakouts was built to help traders take advantage of these squeeze play opportunities.
- Volatility bands display on the chart along with colored squeeze bands and channel fills.
- Toggle (Squeeze Bands) to display "the squeeze" when price action is in a low-volatility range. Default (On).
- The color setting of the squeeze bands controls the color of the channel fill and the squeeze table in the lower-right corner of the chart.
Volatility Bands [\b]
- Gradient shading represents reversal zones based on Bollinger Bands (BB).
- The likelihood of price reversion towards the mean (i.e., basis) increases the further price action pushes into the darker shaded zones.
- The middle area inside the shaded bands (i.e., same color as chart background) is the Keltner channel.
- The Keltner channel is another volatility-based method used to identify breakouts and mean reversion trading opportunities.
- Keltner channel boundaries calculate using the exponential moving average (EMA) and average true range (ATR).
- Toggle (Volatility Basis) to display the basis line (i.e., mean) of the volatility bands. Default (Off).
Squeeze Table [\b]
Aviso legal
As informações e publicações não se destinam a ser, e não constituem, conselhos ou recomendações financeiras, de investimento, comerciais ou de outro tipo fornecidos ou endossados pela TradingView. Leia mais nos Termos de Uso.
Aviso legal
As informações e publicações não se destinam a ser, e não constituem, conselhos ou recomendações financeiras, de investimento, comerciais ou de outro tipo fornecidos ou endossados pela TradingView. Leia mais nos Termos de Uso.