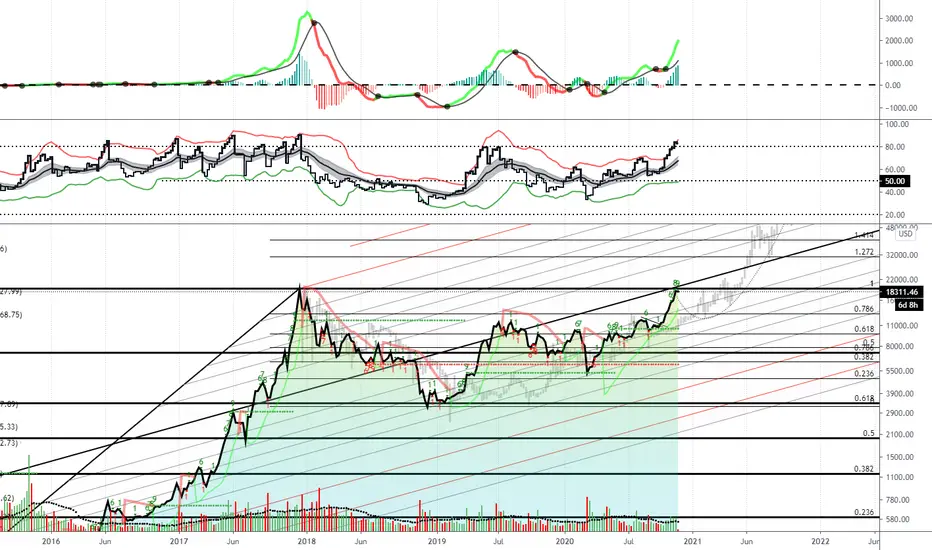
As BTC tests 20K levels, we are looking for this previous ath to come in as hard resistance initially. The TD indicator flashing a green 9 on the weekly time frame, suggesting the end of the bullish weekly count. RSI is over 80% buyers, stretching out the 2 st. deviations on this indicator - suggesting overbought. Ghost bars from 2015-2017 market cycle layered on top of this chart (grey bars) shows the last battle BTC saw as it approached the ath. Looking for this to repeat. I hope you are ready to buy this dip!
Publicações relacionadas
Aviso legal
The information and publications are not meant to be, and do not constitute, financial, investment, trading, or other types of advice or recommendations supplied or endorsed by TradingView. Read more in the Terms of Use.
Publicações relacionadas
Aviso legal
The information and publications are not meant to be, and do not constitute, financial, investment, trading, or other types of advice or recommendations supplied or endorsed by TradingView. Read more in the Terms of Use.