2/2
正式跌破關鍵均線 (記得一點 這是滯後指標)
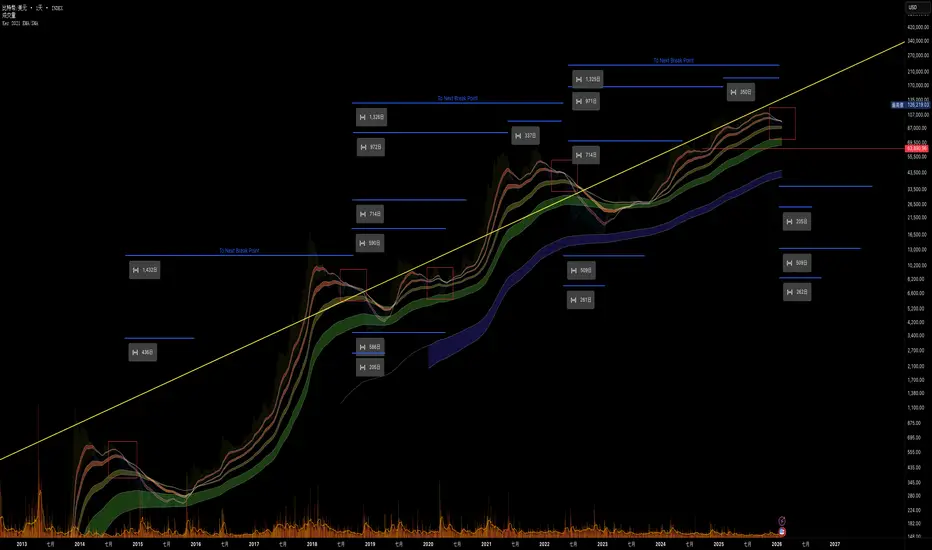
這張圖上的均線是我自己設定的
圖中5個紅框 由左至右分別是
2014/10月 跌破後約10來天有個逃命波 然後直接下殺谷底 一年後才回到牛市
2018/9月 後來在11月暴跌進入熊市到隔年4月才開始復甦
2020/4月 這部分是312事件 “導致”均線下拉 之後迎來一大段的漲幅
2022/5月 跌破後有個短盤整 後來夜市進入谷底
2026/2月 這次情況會如何
簡單數學4次裡面有3次是熊市
唯一例外一次是312導致
換一個視角看 撇除312
前3次跌破後到下一個跌破時間都是1千3百/4百天左右
對照這次時間也是有巧合
型態上有沒有支持 有但是都是熊市架構 很多人已經有發表 這裡就不多做解釋
有沒有樂觀的看法 可以看2023/10月
這邊也是接近“但是”沒有跌破 後來進入牛市
但是現在是已經有效跌破 而且全球局勢影響 樂觀的條件不高
不過這跟312的情況類似 這次是否可以有同樣的”運氣“
可以期待 但是不要等待
另一個比較樂觀的看法是 注意我有一天黃色趨勢線
嚴格說來這條線一直沒有被突破
有兩個解釋 第一個是真的的漲幅還沒來到
第二個解釋是比特幣已經被放棄 所以量能消退
原則上 我認為是漲幅還沒正式開啟 只是被延後
而回到現在的情況 可能要準備面對跌破到綠色均線區域
而63890這個數字 或許會被挑戰 代價會是看到52000
最後一點 引述我1/26的短述
“ 1/26 98000關卡沒破 而且94000沒有支撐 這個是很弱勢的表現 糟糕的是破地盤 原則上破地盤可預期的就是測前底 80800那個區域 而按照斐波那契 深度可以到76500~77500附近 不過目前不至於如此悲觀 如果手上還有85900可以當作一個出場點 而如果還想進88800可以嘗試進一些 記得目前還是空方強但是量有再變多 這算是一個比較好的訊號 但是真的要轉為比較多方的走向要等超過101550而且帶量 ”
很糟糕的是 這樣一直的下跌 要重新拿回市場的信心 反轉點無法下調 101550而且帶量 這個還是目前我堅持 市場要反轉的數字點
2/2

Officially broke below a key moving average
(Remember one thing: this is a lagging indicator)
The moving averages on this chart are custom-set by me.
There are five red boxes on the chart. From left to right:
October 2014
After the breakdown, there was a brief “escape rally” lasting about ten days,
then a direct crash to the bottom.
It took about one year to return to a bull market.
September 2018
Later, in November, the market plunged and entered a bear market,
and it wasn’t until April of the following year that recovery began.
April 2020
This was the 3/12 event, which caused the moving averages to be pulled down.
After that, a long and significant uptrend followed.
May 2022
After the breakdown, there was a short consolidation,
then the market entered the bottom phase.
February 2026
So what will happen this time?
Simple math: out of four instances, three resulted in bear markets.
The only exception was the one caused by the 3/12 event.
Looking from another perspective
Excluding the 3/12 event,
the time between each breakdown and the next breakdown was roughly
1,300–1,400 days.
When compared to the current timing, there is again a coincidental alignment.
From a pattern perspective:
there is some technical support, but it is still within a bear-market structure.
Many people have already discussed this, so I won’t elaborate further.
Is there an optimistic view?
One can look at October 2023:
price came close but did not break below,
and a bull market followed.
However, this time the level has been effectively broken.
Combined with global macro conditions,
the requirements for optimism are not high.
That said, this situation is somewhat similar to 3/12.
Whether we can have the same kind of “luck” this time
is something we can hope for — but not wait for.
A more optimistic interpretation
Pay attention to the yellow trendline I drew.
Strictly speaking, this trendline has never been broken.
There are two possible explanations:
The real upward move has not arrived yet.
Bitcoin has been abandoned, and trading volume has dried up.
In principle, I believe the first explanation is more likely:
the rally has not officially started — it has merely been delayed.
Back to the current situation
We may need to prepare for a move down toward the green moving-average zone.
The level 63,890 may be tested,
and the cost of that would likely be seeing 52,000.
Final point
Quoting my short note from 1/26:
1/26
The 98,000 level failed to break, and 94,000 provided no support.
This is a very weak structure.
Worse still, the price lost its base.
Once the base is lost, it is reasonable to expect a retest of the previous low,
around the 80,800 area.
According to Fibonacci retracement,
the depth could extend to 76,500–77,500,
though at this stage it is not necessary to be that pessimistic.
If you are still holding positions, 85,900 can be considered an exit point.
If you are looking to enter, 88,800 can be tried with a small position.
Remember, bears are still in control,
but volume has started to increase again.
This is a relatively positive signal.
However, for the market to truly shift toward a more bullish structure,
price must break above 101,550 with volume.
Unfortunately, with this continuous decline,
regaining market confidence means the reversal point cannot be lowered.
101,550 with volume
remains the level I firmly insist on
for the market to be considered truly reversing.
正式跌破關鍵均線 (記得一點 這是滯後指標)
這張圖上的均線是我自己設定的
圖中5個紅框 由左至右分別是
2014/10月 跌破後約10來天有個逃命波 然後直接下殺谷底 一年後才回到牛市
2018/9月 後來在11月暴跌進入熊市到隔年4月才開始復甦
2020/4月 這部分是312事件 “導致”均線下拉 之後迎來一大段的漲幅
2022/5月 跌破後有個短盤整 後來夜市進入谷底
2026/2月 這次情況會如何
簡單數學4次裡面有3次是熊市
唯一例外一次是312導致
換一個視角看 撇除312
前3次跌破後到下一個跌破時間都是1千3百/4百天左右
對照這次時間也是有巧合
型態上有沒有支持 有但是都是熊市架構 很多人已經有發表 這裡就不多做解釋
有沒有樂觀的看法 可以看2023/10月
這邊也是接近“但是”沒有跌破 後來進入牛市
但是現在是已經有效跌破 而且全球局勢影響 樂觀的條件不高
不過這跟312的情況類似 這次是否可以有同樣的”運氣“
可以期待 但是不要等待
另一個比較樂觀的看法是 注意我有一天黃色趨勢線
嚴格說來這條線一直沒有被突破
有兩個解釋 第一個是真的的漲幅還沒來到
第二個解釋是比特幣已經被放棄 所以量能消退
原則上 我認為是漲幅還沒正式開啟 只是被延後
而回到現在的情況 可能要準備面對跌破到綠色均線區域
而63890這個數字 或許會被挑戰 代價會是看到52000
最後一點 引述我1/26的短述
“ 1/26 98000關卡沒破 而且94000沒有支撐 這個是很弱勢的表現 糟糕的是破地盤 原則上破地盤可預期的就是測前底 80800那個區域 而按照斐波那契 深度可以到76500~77500附近 不過目前不至於如此悲觀 如果手上還有85900可以當作一個出場點 而如果還想進88800可以嘗試進一些 記得目前還是空方強但是量有再變多 這算是一個比較好的訊號 但是真的要轉為比較多方的走向要等超過101550而且帶量 ”
很糟糕的是 這樣一直的下跌 要重新拿回市場的信心 反轉點無法下調 101550而且帶量 這個還是目前我堅持 市場要反轉的數字點
2/2
Officially broke below a key moving average
(Remember one thing: this is a lagging indicator)
The moving averages on this chart are custom-set by me.
There are five red boxes on the chart. From left to right:
October 2014
After the breakdown, there was a brief “escape rally” lasting about ten days,
then a direct crash to the bottom.
It took about one year to return to a bull market.
September 2018
Later, in November, the market plunged and entered a bear market,
and it wasn’t until April of the following year that recovery began.
April 2020
This was the 3/12 event, which caused the moving averages to be pulled down.
After that, a long and significant uptrend followed.
May 2022
After the breakdown, there was a short consolidation,
then the market entered the bottom phase.
February 2026
So what will happen this time?
Simple math: out of four instances, three resulted in bear markets.
The only exception was the one caused by the 3/12 event.
Looking from another perspective
Excluding the 3/12 event,
the time between each breakdown and the next breakdown was roughly
1,300–1,400 days.
When compared to the current timing, there is again a coincidental alignment.
From a pattern perspective:
there is some technical support, but it is still within a bear-market structure.
Many people have already discussed this, so I won’t elaborate further.
Is there an optimistic view?
One can look at October 2023:
price came close but did not break below,
and a bull market followed.
However, this time the level has been effectively broken.
Combined with global macro conditions,
the requirements for optimism are not high.
That said, this situation is somewhat similar to 3/12.
Whether we can have the same kind of “luck” this time
is something we can hope for — but not wait for.
A more optimistic interpretation
Pay attention to the yellow trendline I drew.
Strictly speaking, this trendline has never been broken.
There are two possible explanations:
The real upward move has not arrived yet.
Bitcoin has been abandoned, and trading volume has dried up.
In principle, I believe the first explanation is more likely:
the rally has not officially started — it has merely been delayed.
Back to the current situation
We may need to prepare for a move down toward the green moving-average zone.
The level 63,890 may be tested,
and the cost of that would likely be seeing 52,000.
Final point
Quoting my short note from 1/26:
1/26
The 98,000 level failed to break, and 94,000 provided no support.
This is a very weak structure.
Worse still, the price lost its base.
Once the base is lost, it is reasonable to expect a retest of the previous low,
around the 80,800 area.
According to Fibonacci retracement,
the depth could extend to 76,500–77,500,
though at this stage it is not necessary to be that pessimistic.
If you are still holding positions, 85,900 can be considered an exit point.
If you are looking to enter, 88,800 can be tried with a small position.
Remember, bears are still in control,
but volume has started to increase again.
This is a relatively positive signal.
However, for the market to truly shift toward a more bullish structure,
price must break above 101,550 with volume.
Unfortunately, with this continuous decline,
regaining market confidence means the reversal point cannot be lowered.
101,550 with volume
remains the level I firmly insist on
for the market to be considered truly reversing.
Aviso legal
As informações e publicações não se destinam a ser, e não constituem, conselhos ou recomendações financeiras, de investimento, comerciais ou de outro tipo fornecidos ou endossados pela TradingView. Leia mais nos Termos de Uso.
Aviso legal
As informações e publicações não se destinam a ser, e não constituem, conselhos ou recomendações financeiras, de investimento, comerciais ou de outro tipo fornecidos ou endossados pela TradingView. Leia mais nos Termos de Uso.