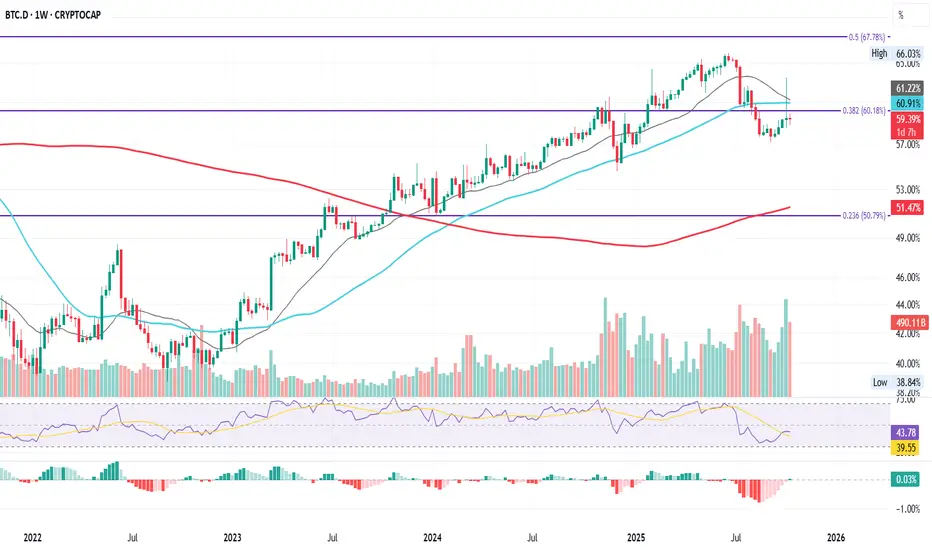
This is BTC Dominance (BTC.D) on the weekly.
After climbing steadily since January 2023, BTC.D followed both the 21-week (grey) and 50-week (cyan) MAs all the way up, reclaiming key Fibonacci levels at 50% (0.236 Fib) and 60% (0.382 Fib) before finally getting rejected at the 0.5 Fib near 67%.
That rejection in June 2025 marked a structural shift: BTC.D dropped below the 21W and 50W MAs, and back under the 0.382 Fib (60%).
Last week’s flash recovery briefly spiked above these levels, but failed to hold, closing back under.
This week’s candle is confirming that weakness again.
Until the 0.382 Fib turns into solid support, dominance remains technically in a downtrend: meaning capital might be slowly rotating away from BTC toward ETH and large-cap alts.
For traders, this level defines the next phase:
Hold above 60% → BTC continues to dominate.
Break lower → rotation and volatility spread wider across the market.
Either way, BTC.D is the map, and this chart is worth watching closely in the coming weeks.
Bias: Bearish-to-neutral short term, trend losing momentum while capital flow diversifies.
Always take profits and manage risk.
Interaction is welcome.
Trade ativo
BTC.D Weekly Series – Short Term Weakness Beneath the SurfaceBTC dominance continues to hover around the 0.382 Fib at 60% a level that has acted as a pivot since early summer.
After the rejection at the 0.5 Fib near 67% in June dominance entered a cooling phase and this week brings another sign of fatigue.
The 21 week MA grey has now crossed below the 50 week MA cyan signalling a shift toward short term weakness inside a broader consolidation phase.
This cross does not confirm a breakdown yet but it shows that momentum is fading after nearly two years of steady BTC strength.
For now price is holding just under the 0.382 Fib and the weekly structure remains indecisive a balance between fading dominance and cautious accumulation.
If BTC.D closes back above 60% it could invalidate this weakness and re-establish control.
But if it slips below 59% that would mark the first clear confirmation of renewed downside pressure.
ETHBTC continues to drift lower retesting the 0.786 Fib 0.0347 for support.
Both charts tell the same story momentum is slowing but structure has not broken yet.
This is the kind of equilibrium that often precedes decisive rotation but timing remains everything.
Bias neutral to bearish structure softening 21W under 50W confirms fading momentum.
Publicações relacionadas
Aviso legal
As informações e publicações não devem ser e não constituem conselhos ou recomendações financeiras, de investimento, de negociação ou de qualquer outro tipo, fornecidas ou endossadas pela TradingView. Leia mais em Termos de uso.
Publicações relacionadas
Aviso legal
As informações e publicações não devem ser e não constituem conselhos ou recomendações financeiras, de investimento, de negociação ou de qualquer outro tipo, fornecidas ou endossadas pela TradingView. Leia mais em Termos de uso.