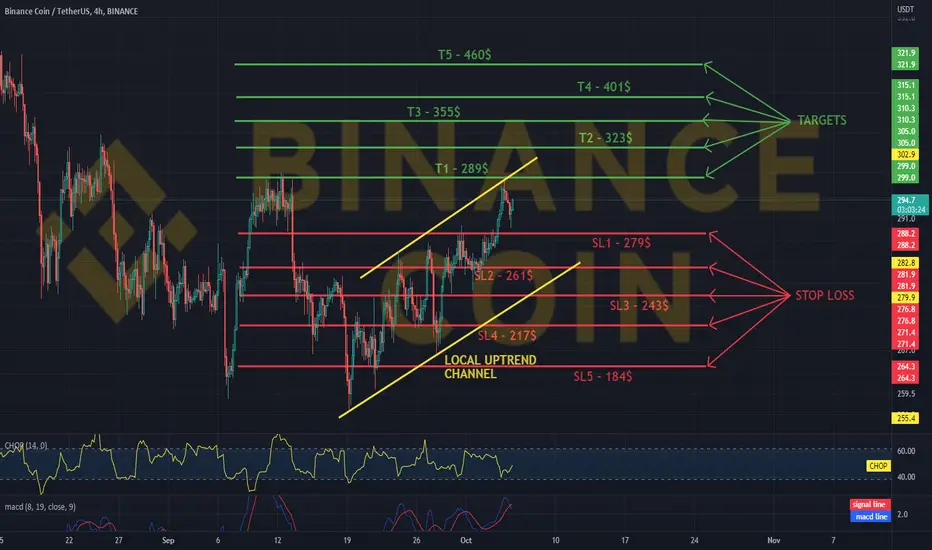
Hello everyone, let's take a look at the 4H BNB to USDT chart as you can see the price is moving in the local uptrend channel.
Let's start by setting goals for the near future that we can consider:
T1 - $ 289
T2 - $ 323
T3 - $ 355
T4 - $ 401
and
T5 - $ 460
Now let's move on to the stop loss in case of further market declines:
SL1 - $ 279
SL2 - $ 261
SL3 - $ 243
SL4 - $ 217
and
SL5 - $ 184
Looking at the CHOP indicator, we can see that in the 4H range the energy slowly starts to rise, while the MACD indicator shows a local downward trend.
Aviso legal
As informações e publicações não devem ser e não constituem conselhos ou recomendações financeiras, de investimento, de negociação ou de qualquer outro tipo, fornecidas ou endossadas pela TradingView. Leia mais em Termos de uso.
Aviso legal
As informações e publicações não devem ser e não constituem conselhos ou recomendações financeiras, de investimento, de negociação ou de qualquer outro tipo, fornecidas ou endossadas pela TradingView. Leia mais em Termos de uso.