View the free live and editable chart right here. You can subscribe to premium to view and edit my other signature models and all my daily posts.
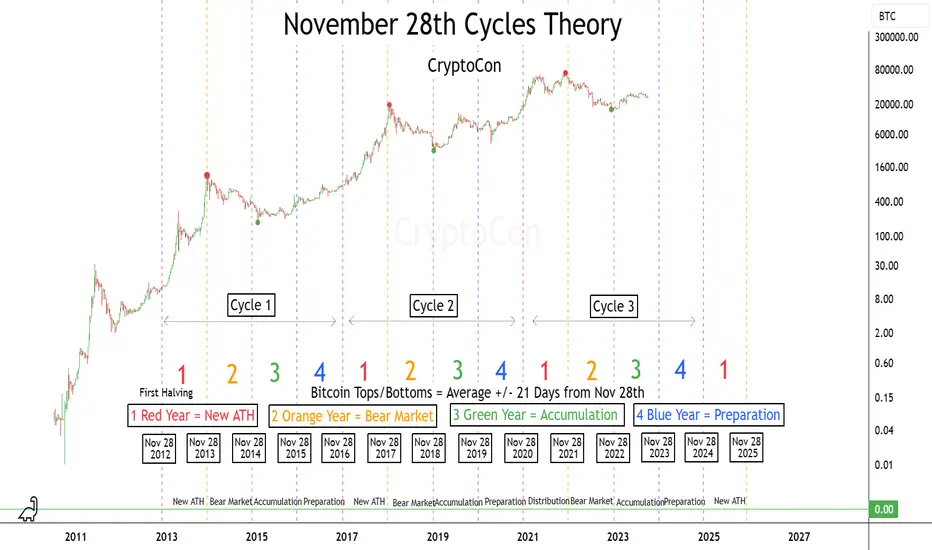
The Theory begins on the day of the first halving, Nov 28th, 2012.
Cycles form between the dates of Nov 28th, and other valuable pieces of information:
Tops: come +/- 21 days from Nov 28th end of Red Year (red dot)
Bottoms: come +/- 21 days from Nov 28th end of Orange Year. (green dot)
1. Red Year (New ATH): New ATHs are made in the year, cycle top forms at the end of the year.
2. Orange Year (Bear Market): Price cools down from its overvaluation and becomes undervalued at a new market bottom.
3. Green Year (Accumulation): The best buying prices of the cycle take place. Price moves towards the median price (half of the previous ATH).
4. Blue Year (Preparation): Price establishes time around the median and makes an advance towards new ATHs at the end of the year.
Aviso legal
As informações e publicações não devem ser e não constituem conselhos ou recomendações financeiras, de investimento, de negociação ou de qualquer outro tipo, fornecidas ou endossadas pela TradingView. Leia mais em Termos de uso.
Aviso legal
As informações e publicações não devem ser e não constituem conselhos ou recomendações financeiras, de investimento, de negociação ou de qualquer outro tipo, fornecidas ou endossadas pela TradingView. Leia mais em Termos de uso.