Bitcoin just made a historical unprecedented correction as expected in my last update on the Bitcoin chart. Predicting the bottom is not an easy job to do but everyone is dropping their opinions on it, Mine is here too.
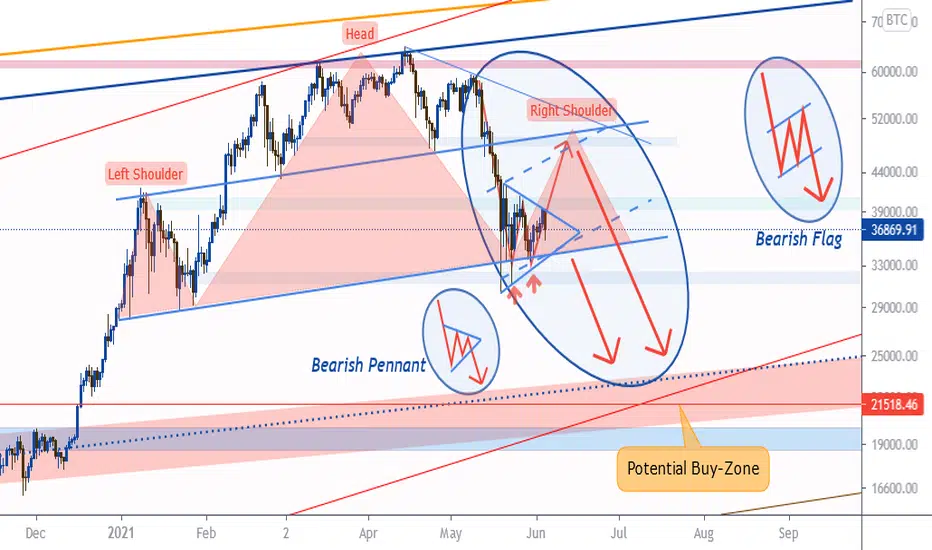
BTC painted an obvious head and shoulders pattern on the daily chart and it's going to make the right shoulder in the form of a bearish flag (or maybe a bearish-pennant). Also, a double-bottom pattern is recognizable on the chart, breaking out of this double-bottom neckline (41K) can recover the price to 48K again which is an important resistance level to make the right shoulder and the top of the bearish-flag. If the price rejects this resistance at 48K we can expect another leg down to 20K channel which is the end of this correction in my opinion.
This analysis will be invalidated if the price closes a daily candle above 50K
Analyses are NOT financial advice; DYOR
Publicações relacionadas
Aviso legal
As informações e publicações não se destinam a ser, e não constituem, conselhos ou recomendações financeiras, de investimento, comerciais ou de outro tipo fornecidos ou endossados pela TradingView. Leia mais nos Termos de Uso.