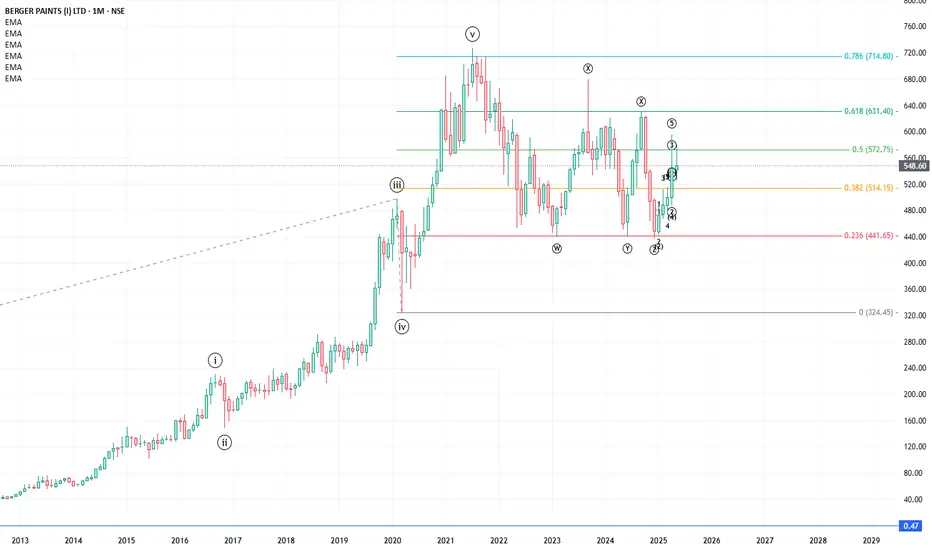
A stock after it reaches it 5th wave of larger degree undergoes either a price-wise correction or a time-wise correction or both. Here is a beautiful chart which depicts how Berger paint underwent a time-wise correction over 3 years as a WXYXZ pattern, concluding each wave at the same point.
Nota
Each of wave w,y,z concluded at the fibo extension of wave (0-iii to iv) of 0.236. Actual correction started in July 21 and ended in Dec 24. ChartTheWave |
t.me/chartthewave
This channel is a common forum for "Elliott Wave Principle" enthusiasts, learners and practitioners. We aim to build a team of traders who practice EWP for common benefit; co-learn, teach, share, validate and benefit.
t.me/chartthewave
This channel is a common forum for "Elliott Wave Principle" enthusiasts, learners and practitioners. We aim to build a team of traders who practice EWP for common benefit; co-learn, teach, share, validate and benefit.
Aviso legal
As informações e publicações não se destinam a ser, e não constituem, conselhos ou recomendações financeiras, de investimento, comerciais ou de outro tipo fornecidos ou endossados pela TradingView. Leia mais nos Termos de Uso.
ChartTheWave |
t.me/chartthewave
This channel is a common forum for "Elliott Wave Principle" enthusiasts, learners and practitioners. We aim to build a team of traders who practice EWP for common benefit; co-learn, teach, share, validate and benefit.
t.me/chartthewave
This channel is a common forum for "Elliott Wave Principle" enthusiasts, learners and practitioners. We aim to build a team of traders who practice EWP for common benefit; co-learn, teach, share, validate and benefit.
Aviso legal
As informações e publicações não se destinam a ser, e não constituem, conselhos ou recomendações financeiras, de investimento, comerciais ou de outro tipo fornecidos ou endossados pela TradingView. Leia mais nos Termos de Uso.