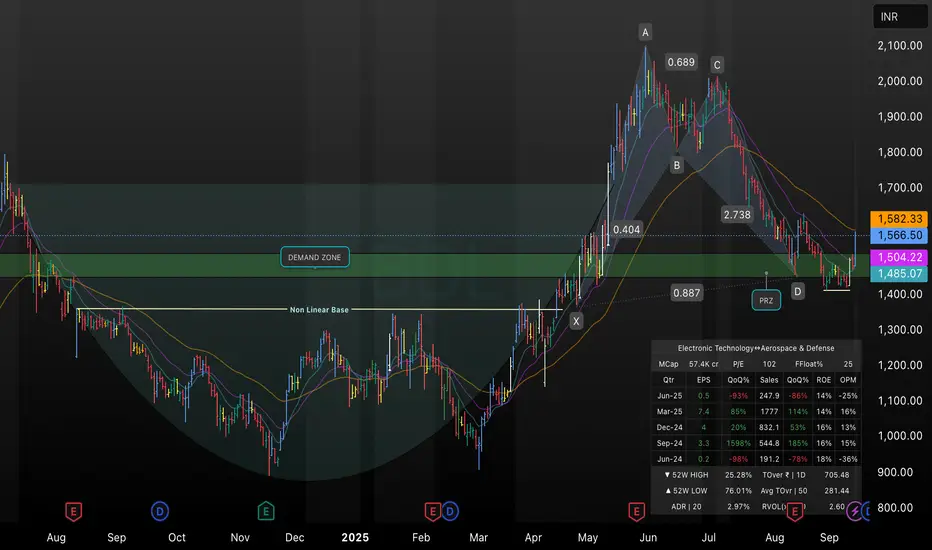
This daily chart of BDL highlights a completed bullish harmonic pattern converging with a strong demand zone between ₹1,480–₹1,510. The recent reversal from the Potential Reversal Zone (PRZ) and the overlap with the nonlinear base signal accumulation, while the confluence of 21/50 EMA suggests short-term support. Key resistance lies near ₹1,580; a break above may extend the upmove, while failure to hold ₹1,485 could invalidate the bullish setup. This chart is intended for educational and technical analysis purposes only.
Aviso legal
As informações e publicações não devem ser e não constituem conselhos ou recomendações financeiras, de investimento, de negociação ou de qualquer outro tipo, fornecidas ou endossadas pela TradingView. Leia mais em Termos de uso.
Aviso legal
As informações e publicações não devem ser e não constituem conselhos ou recomendações financeiras, de investimento, de negociação ou de qualquer outro tipo, fornecidas ou endossadas pela TradingView. Leia mais em Termos de uso.