🚀 Breakout Stock Alert: BASF India Ltd (BASF)
📌 Price: ₹4,902.90 📊 Volume: 138.03K 📅 Date: 19-05-2025
① Pattern Name, Timeframe, Structure & Explanation
Daily Timeframe: Rectangle Base Pattern (5 Months)
Weekly Timeframe: Base Formation in Uptrend
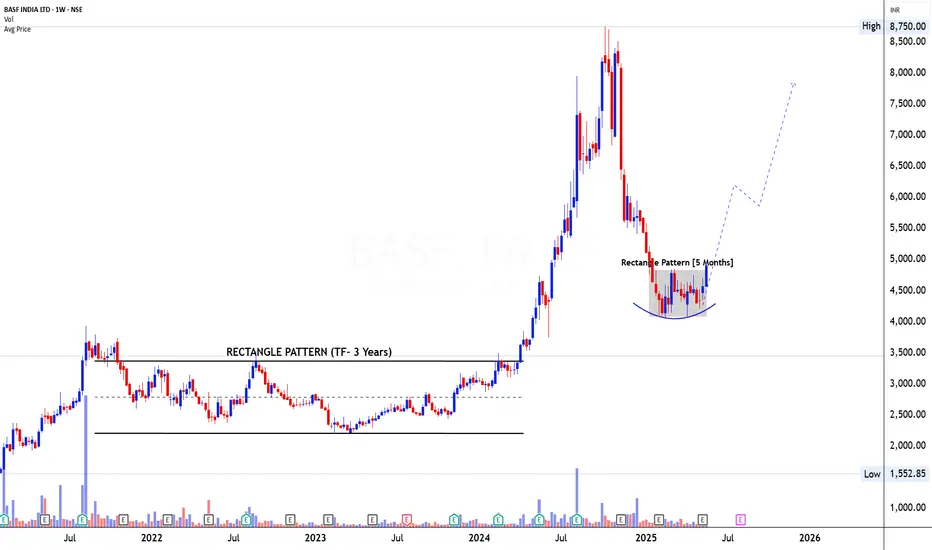
On the daily chart, BASF has been coiling inside a rectangle consolidation pattern between ₹4,300–₹4,800 for nearly 5 months. The base is tight, with volatility compression and a subtle rounding shape at the lower support, hinting at accumulation. The recent breakout from this rectangle comes on the back of strong bullish action with increasing range and volume — indicating supply absorption and demand dominance.
On the weekly chart, this move gains even more significance. BASF had spent nearly 3 years (2021–2023) inside a broad rectangle, eventually giving a massive upside breakout in 2024. The recent pullback post-highs around ₹8,750 has now rounded out into a basing structure — potentially forming the right side of a new base, suggesting a continuation of the broader uptrend.
② Volume Formation (During Pattern, Breakout, and Retest)
Daily Timeframe: Volume remained muted within the rectangle, showing lack of interest during the base — a common trait in high-quality accumulation phases. The breakout candle on 19 May shows volume spike to 138K, far above the base average, confirming institutional buying interest.
Weekly Timeframe: Volume clearly dried up during the correction phase post-2024 top, and has now started building up again as price reclaims previous support-turned-base zones.
③ Breakout Candlestick, Follow-Through & Trap Behavior
Breakout Candle (Daily): A wide-range, full-bodied bullish candle with gap-up characteristics and a +7.2% move, backed by a sharp volume surge — textbook breakout behavior
Follow-Through Watch: The stock may now retest the breakout zone of ₹4,750–₹4,800. A low-volume pullback would offer a healthy re-entry.
Trap Behavior: No signs of fakeouts or premature breakdowns. The rectangle was tight and clean — this breakout appears genuine and well-structured.
④ Trade Explanation (Entry, Target, Stop-loss, Risk\:Reward)
Entry Zone: ₹4,880–₹4,950 (near breakout close or minor dip)
Stop-loss: ₹4,600 (below rectangle low and base support)
*Target Zone: ₹6,200 (initial), ₹7,200–₹7,500 (long-term structure)
📏 Measured Move (Rectangle Range):
Range = ₹4,800 - ₹4,300 = ₹500
Target = ₹4,800 + ₹500 = ₹5,300 (short-term)
But considering weekly rounding base, extended moves toward ₹6,200+ are probable.
Risk\:Reward Analysis:
Risk = ₹350
Reward = ₹1,200–₹2,300
R\:R = \~1:3.4 to 1:6.5
#Trading #Investing #Stocks #TechnicalAnalysis
📌 Price: ₹4,902.90 📊 Volume: 138.03K 📅 Date: 19-05-2025
① Pattern Name, Timeframe, Structure & Explanation
Daily Timeframe: Rectangle Base Pattern (5 Months)
Weekly Timeframe: Base Formation in Uptrend
On the daily chart, BASF has been coiling inside a rectangle consolidation pattern between ₹4,300–₹4,800 for nearly 5 months. The base is tight, with volatility compression and a subtle rounding shape at the lower support, hinting at accumulation. The recent breakout from this rectangle comes on the back of strong bullish action with increasing range and volume — indicating supply absorption and demand dominance.
On the weekly chart, this move gains even more significance. BASF had spent nearly 3 years (2021–2023) inside a broad rectangle, eventually giving a massive upside breakout in 2024. The recent pullback post-highs around ₹8,750 has now rounded out into a basing structure — potentially forming the right side of a new base, suggesting a continuation of the broader uptrend.
② Volume Formation (During Pattern, Breakout, and Retest)
Daily Timeframe: Volume remained muted within the rectangle, showing lack of interest during the base — a common trait in high-quality accumulation phases. The breakout candle on 19 May shows volume spike to 138K, far above the base average, confirming institutional buying interest.
Weekly Timeframe: Volume clearly dried up during the correction phase post-2024 top, and has now started building up again as price reclaims previous support-turned-base zones.
③ Breakout Candlestick, Follow-Through & Trap Behavior
Breakout Candle (Daily): A wide-range, full-bodied bullish candle with gap-up characteristics and a +7.2% move, backed by a sharp volume surge — textbook breakout behavior
Follow-Through Watch: The stock may now retest the breakout zone of ₹4,750–₹4,800. A low-volume pullback would offer a healthy re-entry.
Trap Behavior: No signs of fakeouts or premature breakdowns. The rectangle was tight and clean — this breakout appears genuine and well-structured.
④ Trade Explanation (Entry, Target, Stop-loss, Risk\:Reward)
Entry Zone: ₹4,880–₹4,950 (near breakout close or minor dip)
Stop-loss: ₹4,600 (below rectangle low and base support)
*Target Zone: ₹6,200 (initial), ₹7,200–₹7,500 (long-term structure)
📏 Measured Move (Rectangle Range):
Range = ₹4,800 - ₹4,300 = ₹500
Target = ₹4,800 + ₹500 = ₹5,300 (short-term)
But considering weekly rounding base, extended moves toward ₹6,200+ are probable.
Risk\:Reward Analysis:
Risk = ₹350
Reward = ₹1,200–₹2,300
R\:R = \~1:3.4 to 1:6.5
#Trading #Investing #Stocks #TechnicalAnalysis
Learn Today for Better Tomorrow
Aviso legal
As informações e publicações não se destinam a ser, e não constituem, conselhos ou recomendações financeiras, de investimento, comerciais ou de outro tipo fornecidos ou endossados pela TradingView. Leia mais nos Termos de Uso.
Learn Today for Better Tomorrow
Aviso legal
As informações e publicações não se destinam a ser, e não constituem, conselhos ou recomendações financeiras, de investimento, comerciais ou de outro tipo fornecidos ou endossados pela TradingView. Leia mais nos Termos de Uso.